Carpatho Rusyn vs Immigrants from Zimbabwe 10th Grade
COMPARE
Carpatho Rusyn
Immigrants from Zimbabwe
10th Grade
10th Grade Comparison
Carpatho Rusyns
Immigrants from Zimbabwe
95.9%
10TH GRADE
100.0/ 100
METRIC RATING
5th/ 347
METRIC RANK
94.4%
10TH GRADE
96.8/ 100
METRIC RATING
111th/ 347
METRIC RANK
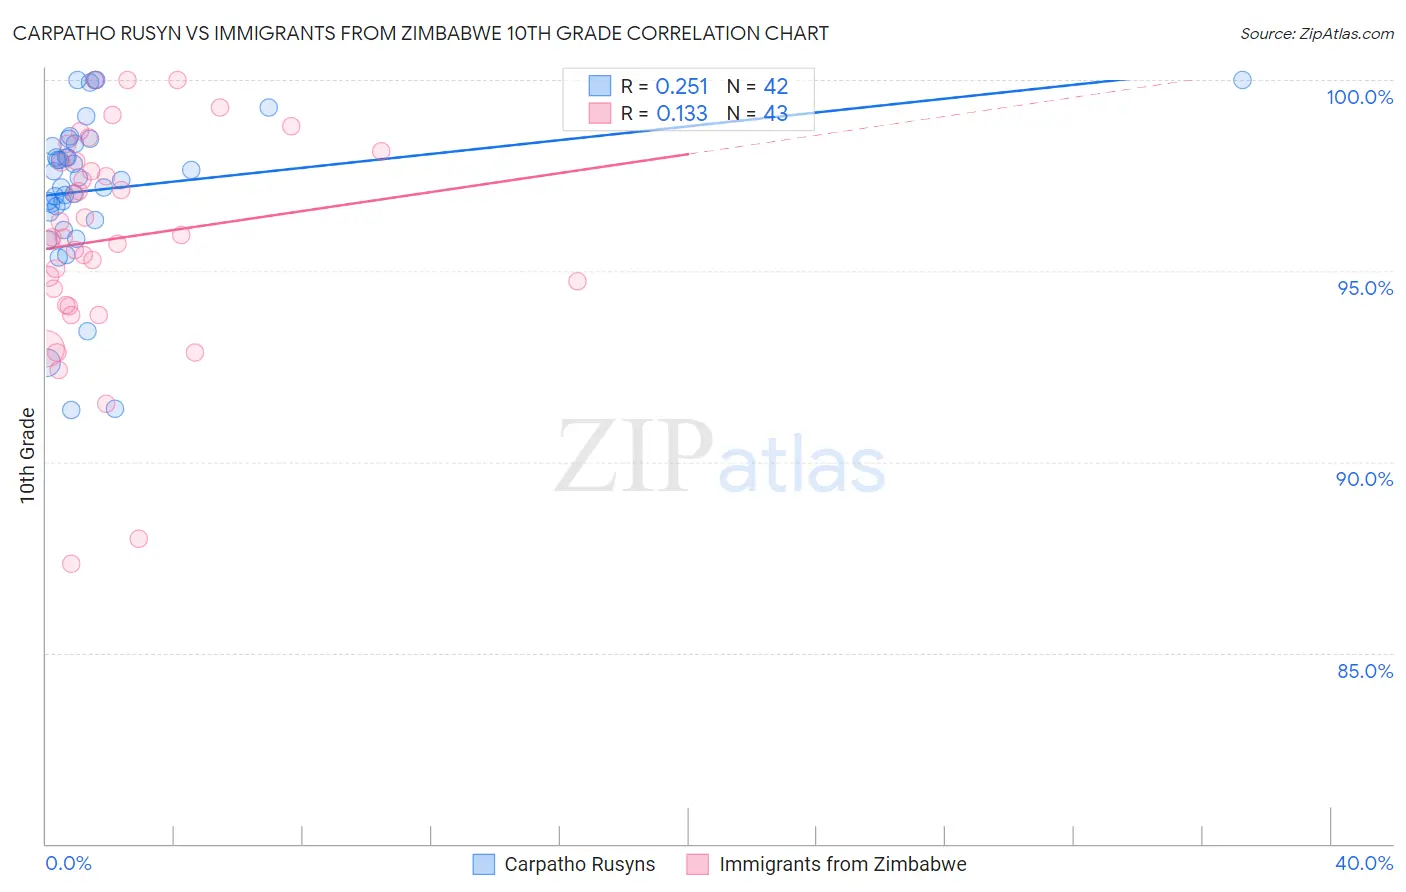
Carpatho Rusyn vs Immigrants from Zimbabwe 10th Grade Correlation Chart
The statistical analysis conducted on geographies consisting of 58,871,690 people shows a weak positive correlation between the proportion of Carpatho Rusyns and percentage of population with at least 10th grade education in the United States with a correlation coefficient (R) of 0.251 and weighted average of 95.9%. Similarly, the statistical analysis conducted on geographies consisting of 117,809,691 people shows a poor positive correlation between the proportion of Immigrants from Zimbabwe and percentage of population with at least 10th grade education in the United States with a correlation coefficient (R) of 0.133 and weighted average of 94.4%, a difference of 1.6%.
10th Grade Correlation Summary
| Measurement | Carpatho Rusyn | Immigrants from Zimbabwe |
| Minimum | 91.4% | 87.3% |
| Maximum | 100.0% | 100.0% |
| Range | 8.6% | 12.7% |
| Mean | 97.2% | 95.8% |
| Median | 97.4% | 95.9% |
| Interquartile 25% (IQ1) | 96.5% | 94.1% |
| Interquartile 75% (IQ3) | 98.3% | 97.9% |
| Interquartile Range (IQR) | 1.8% | 3.8% |
| Standard Deviation (Sample) | 2.1% | 2.8% |
| Standard Deviation (Population) | 2.0% | 2.8% |
Similar Demographics by 10th Grade
Demographics Similar to Carpatho Rusyns by 10th Grade
In terms of 10th grade, the demographic groups most similar to Carpatho Rusyns are Slovene (95.9%, a difference of 0.020%), Swedish (95.9%, a difference of 0.020%), Polish (95.8%, a difference of 0.10%), German (95.8%, a difference of 0.11%), and Slovak (96.0%, a difference of 0.12%).
| Demographics | Rating | Rank | 10th Grade |
| Norwegians | 100.0 /100 | #1 | Exceptional 96.2% |
| Slovaks | 100.0 /100 | #2 | Exceptional 96.0% |
| Slovenes | 100.0 /100 | #3 | Exceptional 95.9% |
| Swedes | 100.0 /100 | #4 | Exceptional 95.9% |
| Carpatho Rusyns | 100.0 /100 | #5 | Exceptional 95.9% |
| Poles | 100.0 /100 | #6 | Exceptional 95.8% |
| Germans | 100.0 /100 | #7 | Exceptional 95.8% |
| Lithuanians | 100.0 /100 | #8 | Exceptional 95.8% |
| Finns | 100.0 /100 | #9 | Exceptional 95.8% |
| Croatians | 100.0 /100 | #10 | Exceptional 95.7% |
| Danes | 100.0 /100 | #11 | Exceptional 95.7% |
| Tlingit-Haida | 100.0 /100 | #12 | Exceptional 95.7% |
| English | 100.0 /100 | #13 | Exceptional 95.6% |
| Tsimshian | 100.0 /100 | #14 | Exceptional 95.6% |
| Irish | 100.0 /100 | #15 | Exceptional 95.6% |
Demographics Similar to Immigrants from Zimbabwe by 10th Grade
In terms of 10th grade, the demographic groups most similar to Immigrants from Zimbabwe are Immigrants from Kuwait (94.4%, a difference of 0.010%), Burmese (94.5%, a difference of 0.020%), Palestinian (94.4%, a difference of 0.020%), Immigrants from North Macedonia (94.5%, a difference of 0.030%), and Immigrants from Norway (94.5%, a difference of 0.030%).
| Demographics | Rating | Rank | 10th Grade |
| Immigrants | Romania | 97.5 /100 | #104 | Exceptional 94.5% |
| Immigrants | Turkey | 97.4 /100 | #105 | Exceptional 94.5% |
| Immigrants | Serbia | 97.4 /100 | #106 | Exceptional 94.5% |
| Immigrants | Croatia | 97.4 /100 | #107 | Exceptional 94.5% |
| Immigrants | North Macedonia | 97.2 /100 | #108 | Exceptional 94.5% |
| Immigrants | Norway | 97.2 /100 | #109 | Exceptional 94.5% |
| Burmese | 97.1 /100 | #110 | Exceptional 94.5% |
| Immigrants | Zimbabwe | 96.8 /100 | #111 | Exceptional 94.4% |
| Immigrants | Kuwait | 96.8 /100 | #112 | Exceptional 94.4% |
| Palestinians | 96.5 /100 | #113 | Exceptional 94.4% |
| German Russians | 96.3 /100 | #114 | Exceptional 94.4% |
| Delaware | 96.3 /100 | #115 | Exceptional 94.4% |
| Sioux | 96.2 /100 | #116 | Exceptional 94.4% |
| Immigrants | Hungary | 95.8 /100 | #117 | Exceptional 94.4% |
| Jordanians | 95.6 /100 | #118 | Exceptional 94.4% |