Tongan vs Immigrants from the Azores 3rd Grade
COMPARE
Tongan
Immigrants from the Azores
3rd Grade
3rd Grade Comparison
Tongans
Immigrants from the Azores
97.5%
3RD GRADE
4.3/ 100
METRIC RATING
225th/ 347
METRIC RANK
96.6%
3RD GRADE
0.0/ 100
METRIC RATING
315th/ 347
METRIC RANK
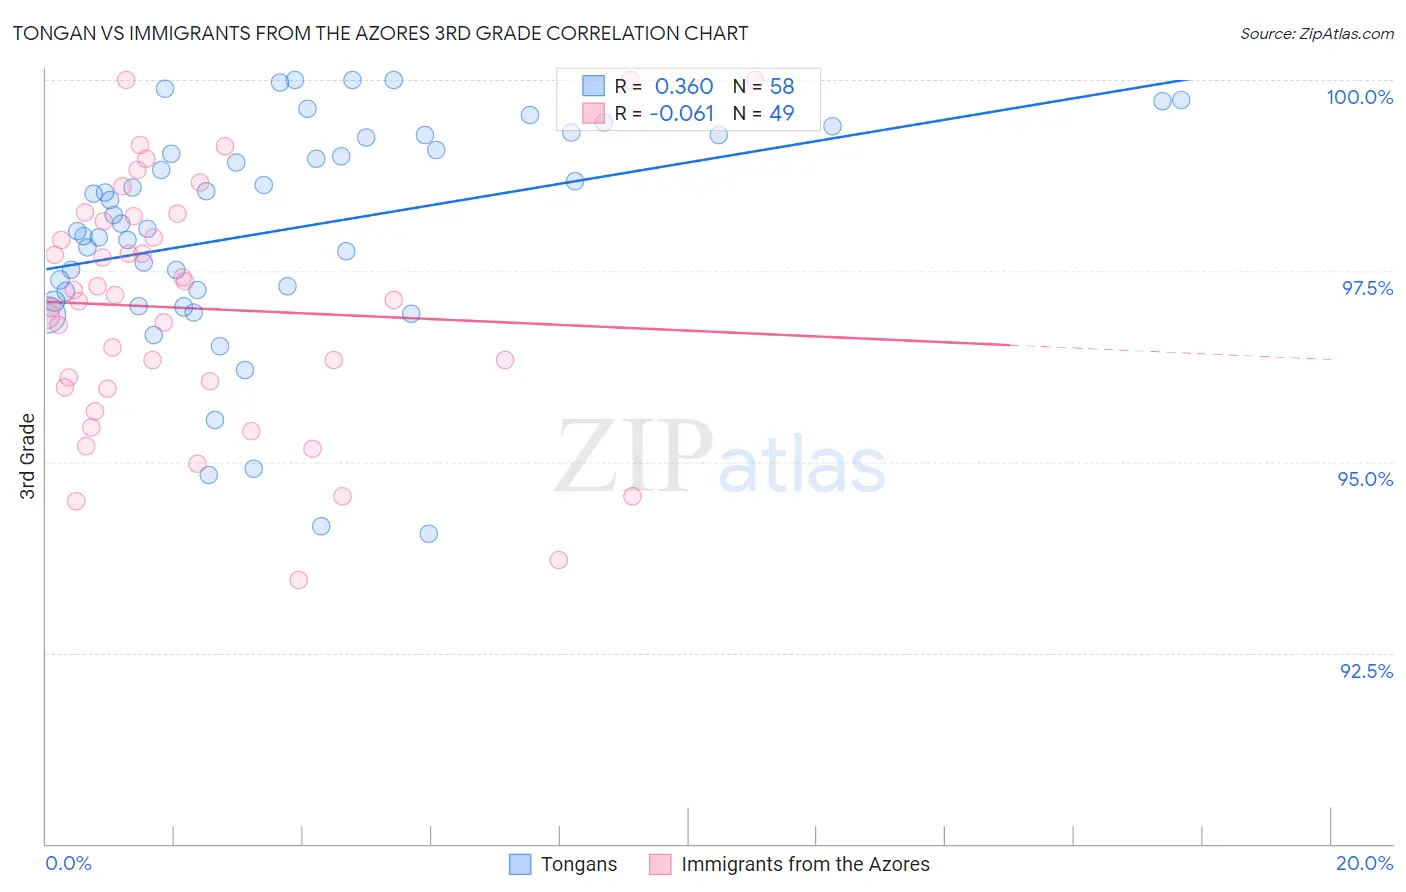
Tongan vs Immigrants from the Azores 3rd Grade Correlation Chart
The statistical analysis conducted on geographies consisting of 102,908,759 people shows a mild positive correlation between the proportion of Tongans and percentage of population with at least 3rd grade education in the United States with a correlation coefficient (R) of 0.360 and weighted average of 97.5%. Similarly, the statistical analysis conducted on geographies consisting of 46,257,310 people shows a slight negative correlation between the proportion of Immigrants from the Azores and percentage of population with at least 3rd grade education in the United States with a correlation coefficient (R) of -0.061 and weighted average of 96.6%, a difference of 0.96%.
3rd Grade Correlation Summary
| Measurement | Tongan | Immigrants from the Azores |
| Minimum | 94.1% | 93.4% |
| Maximum | 100.0% | 100.0% |
| Range | 5.9% | 6.6% |
| Mean | 98.0% | 97.0% |
| Median | 98.2% | 97.1% |
| Interquartile 25% (IQ1) | 97.2% | 96.0% |
| Interquartile 75% (IQ3) | 99.3% | 98.2% |
| Interquartile Range (IQR) | 2.0% | 2.2% |
| Standard Deviation (Sample) | 1.5% | 1.6% |
| Standard Deviation (Population) | 1.4% | 1.6% |
Similar Demographics by 3rd Grade
Demographics Similar to Tongans by 3rd Grade
In terms of 3rd grade, the demographic groups most similar to Tongans are Sierra Leonean (97.5%, a difference of 0.0%), Immigrants from Syria (97.5%, a difference of 0.0%), Bahamian (97.5%, a difference of 0.0%), Sudanese (97.5%, a difference of 0.0%), and Immigrants from Morocco (97.5%, a difference of 0.010%).
| Demographics | Rating | Rank | 3rd Grade |
| Immigrants | Nepal | 5.3 /100 | #218 | Tragic 97.5% |
| Immigrants | Panama | 5.2 /100 | #219 | Tragic 97.5% |
| Immigrants | Morocco | 5.0 /100 | #220 | Tragic 97.5% |
| Uruguayans | 5.0 /100 | #221 | Tragic 97.5% |
| Sierra Leoneans | 4.6 /100 | #222 | Tragic 97.5% |
| Immigrants | Syria | 4.4 /100 | #223 | Tragic 97.5% |
| Bahamians | 4.4 /100 | #224 | Tragic 97.5% |
| Tongans | 4.3 /100 | #225 | Tragic 97.5% |
| Sudanese | 4.1 /100 | #226 | Tragic 97.5% |
| Immigrants | Sudan | 3.4 /100 | #227 | Tragic 97.5% |
| Sub-Saharan Africans | 3.2 /100 | #228 | Tragic 97.5% |
| Senegalese | 3.0 /100 | #229 | Tragic 97.5% |
| Immigrants | Pakistan | 2.7 /100 | #230 | Tragic 97.5% |
| Immigrants | Costa Rica | 2.7 /100 | #231 | Tragic 97.5% |
| Immigrants | Western Asia | 2.6 /100 | #232 | Tragic 97.5% |
Demographics Similar to Immigrants from the Azores by 3rd Grade
In terms of 3rd grade, the demographic groups most similar to Immigrants from the Azores are Immigrants from Ecuador (96.6%, a difference of 0.010%), Belizean (96.6%, a difference of 0.010%), Immigrants from Burma/Myanmar (96.6%, a difference of 0.010%), Immigrants from Laos (96.6%, a difference of 0.020%), and Immigrants from Bangladesh (96.6%, a difference of 0.030%).
| Demographics | Rating | Rank | 3rd Grade |
| Immigrants | Haiti | 0.0 /100 | #308 | Tragic 96.7% |
| Sri Lankans | 0.0 /100 | #309 | Tragic 96.7% |
| Cape Verdeans | 0.0 /100 | #310 | Tragic 96.6% |
| Immigrants | Guyana | 0.0 /100 | #311 | Tragic 96.6% |
| Immigrants | Laos | 0.0 /100 | #312 | Tragic 96.6% |
| Immigrants | Ecuador | 0.0 /100 | #313 | Tragic 96.6% |
| Belizeans | 0.0 /100 | #314 | Tragic 96.6% |
| Immigrants | Azores | 0.0 /100 | #315 | Tragic 96.6% |
| Immigrants | Burma/Myanmar | 0.0 /100 | #316 | Tragic 96.6% |
| Immigrants | Bangladesh | 0.0 /100 | #317 | Tragic 96.6% |
| Hispanics or Latinos | 0.0 /100 | #318 | Tragic 96.5% |
| Vietnamese | 0.0 /100 | #319 | Tragic 96.5% |
| Immigrants | Nicaragua | 0.0 /100 | #320 | Tragic 96.5% |
| Indonesians | 0.0 /100 | #321 | Tragic 96.5% |
| Immigrants | Belize | 0.0 /100 | #322 | Tragic 96.5% |