Immigrants from Grenada vs Immigrants from the Azores 10th Grade
COMPARE
Immigrants from Grenada
Immigrants from the Azores
10th Grade
10th Grade Comparison
Immigrants from Grenada
Immigrants from the Azores
91.6%
10TH GRADE
0.0/ 100
METRIC RATING
296th/ 347
METRIC RANK
89.0%
10TH GRADE
0.0/ 100
METRIC RATING
332nd/ 347
METRIC RANK
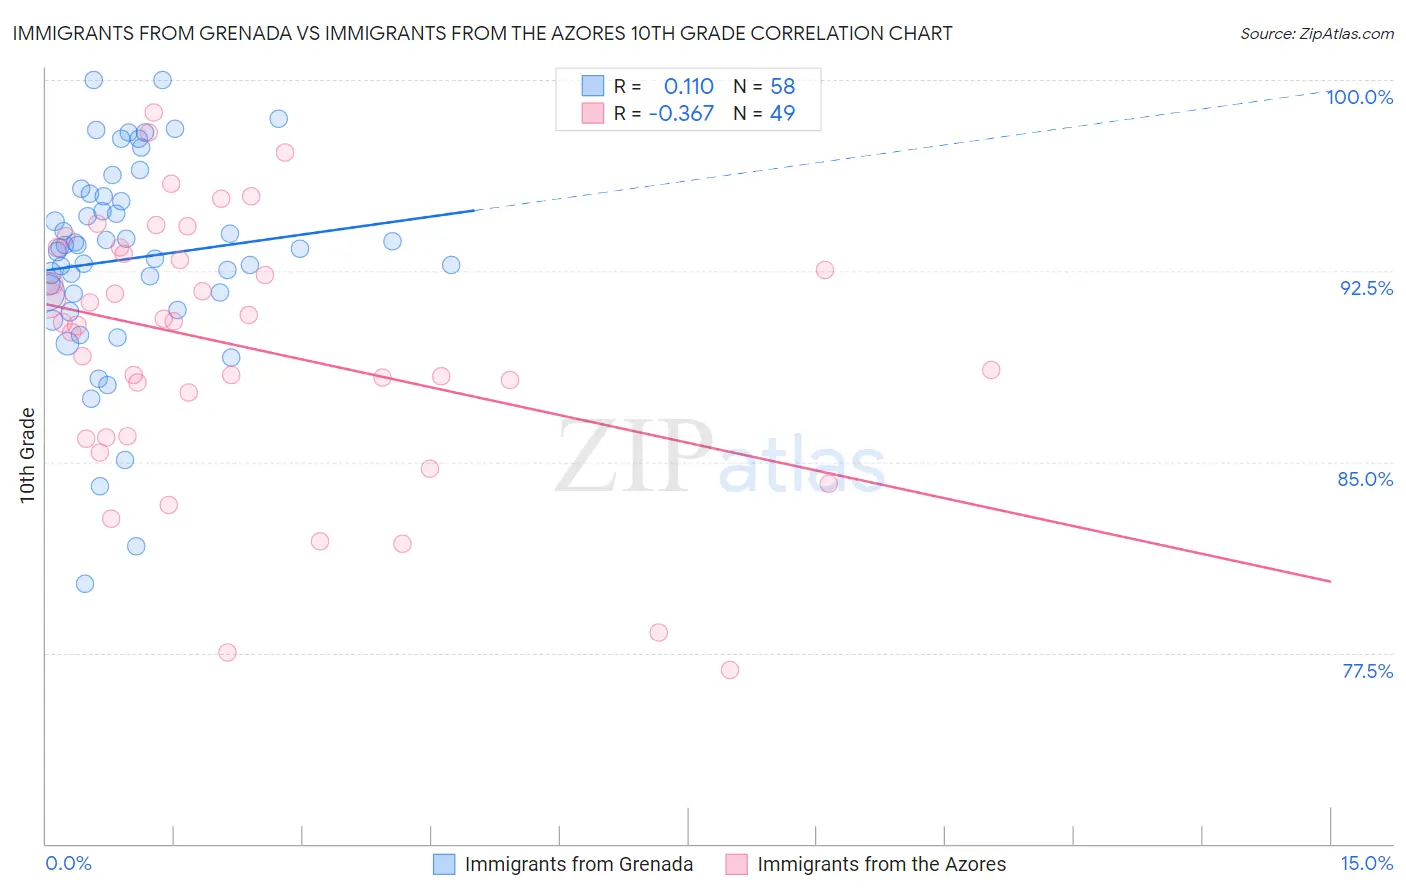
Immigrants from Grenada vs Immigrants from the Azores 10th Grade Correlation Chart
The statistical analysis conducted on geographies consisting of 67,199,790 people shows a poor positive correlation between the proportion of Immigrants from Grenada and percentage of population with at least 10th grade education in the United States with a correlation coefficient (R) of 0.110 and weighted average of 91.6%. Similarly, the statistical analysis conducted on geographies consisting of 46,257,310 people shows a mild negative correlation between the proportion of Immigrants from the Azores and percentage of population with at least 10th grade education in the United States with a correlation coefficient (R) of -0.367 and weighted average of 89.0%, a difference of 3.0%.
10th Grade Correlation Summary
| Measurement | Immigrants from Grenada | Immigrants from the Azores |
| Minimum | 80.2% | 76.8% |
| Maximum | 100.0% | 98.7% |
| Range | 19.8% | 21.9% |
| Mean | 93.0% | 89.5% |
| Median | 93.4% | 90.5% |
| Interquartile 25% (IQ1) | 91.6% | 86.0% |
| Interquartile 75% (IQ3) | 95.4% | 93.3% |
| Interquartile Range (IQR) | 3.8% | 7.3% |
| Standard Deviation (Sample) | 4.1% | 5.1% |
| Standard Deviation (Population) | 4.0% | 5.1% |
Similar Demographics by 10th Grade
Demographics Similar to Immigrants from Grenada by 10th Grade
In terms of 10th grade, the demographic groups most similar to Immigrants from Grenada are Lumbee (91.7%, a difference of 0.13%), Fijian (91.5%, a difference of 0.14%), Haitian (91.8%, a difference of 0.15%), Cuban (91.5%, a difference of 0.17%), and Indonesian (91.8%, a difference of 0.19%).
| Demographics | Rating | Rank | 10th Grade |
| Sri Lankans | 0.0 /100 | #289 | Tragic 91.8% |
| British West Indians | 0.0 /100 | #290 | Tragic 91.8% |
| Immigrants | West Indies | 0.0 /100 | #291 | Tragic 91.8% |
| Immigrants | Burma/Myanmar | 0.0 /100 | #292 | Tragic 91.8% |
| Indonesians | 0.0 /100 | #293 | Tragic 91.8% |
| Haitians | 0.0 /100 | #294 | Tragic 91.8% |
| Lumbee | 0.0 /100 | #295 | Tragic 91.7% |
| Immigrants | Grenada | 0.0 /100 | #296 | Tragic 91.6% |
| Fijians | 0.0 /100 | #297 | Tragic 91.5% |
| Cubans | 0.0 /100 | #298 | Tragic 91.5% |
| Immigrants | Haiti | 0.0 /100 | #299 | Tragic 91.4% |
| Guyanese | 0.0 /100 | #300 | Tragic 91.4% |
| Japanese | 0.0 /100 | #301 | Tragic 91.2% |
| Immigrants | Guyana | 0.0 /100 | #302 | Tragic 91.2% |
| Immigrants | Vietnam | 0.0 /100 | #303 | Tragic 91.2% |
Demographics Similar to Immigrants from the Azores by 10th Grade
In terms of 10th grade, the demographic groups most similar to Immigrants from the Azores are Honduran (89.0%, a difference of 0.030%), Mexican American Indian (89.0%, a difference of 0.040%), Immigrants from Yemen (89.1%, a difference of 0.070%), Hispanic or Latino (88.9%, a difference of 0.15%), and Immigrants from Dominican Republic (88.7%, a difference of 0.33%).
| Demographics | Rating | Rank | 10th Grade |
| Puerto Ricans | 0.0 /100 | #325 | Tragic 89.8% |
| Central American Indians | 0.0 /100 | #326 | Tragic 89.7% |
| Immigrants | Nicaragua | 0.0 /100 | #327 | Tragic 89.5% |
| Immigrants | Cabo Verde | 0.0 /100 | #328 | Tragic 89.5% |
| Dominicans | 0.0 /100 | #329 | Tragic 89.4% |
| Immigrants | Yemen | 0.0 /100 | #330 | Tragic 89.1% |
| Mexican American Indians | 0.0 /100 | #331 | Tragic 89.0% |
| Immigrants | Azores | 0.0 /100 | #332 | Tragic 89.0% |
| Hondurans | 0.0 /100 | #333 | Tragic 89.0% |
| Hispanics or Latinos | 0.0 /100 | #334 | Tragic 88.9% |
| Immigrants | Dominican Republic | 0.0 /100 | #335 | Tragic 88.7% |
| Immigrants | Honduras | 0.0 /100 | #336 | Tragic 88.5% |
| Central Americans | 0.0 /100 | #337 | Tragic 88.4% |
| Immigrants | Latin America | 0.0 /100 | #338 | Tragic 88.3% |
| Guatemalans | 0.0 /100 | #339 | Tragic 87.9% |