Tongan vs Immigrants from the Azores 2nd Grade
COMPARE
Tongan
Immigrants from the Azores
2nd Grade
2nd Grade Comparison
Tongans
Immigrants from the Azores
97.6%
2ND GRADE
4.3/ 100
METRIC RATING
225th/ 347
METRIC RANK
96.8%
2ND GRADE
0.0/ 100
METRIC RATING
307th/ 347
METRIC RANK
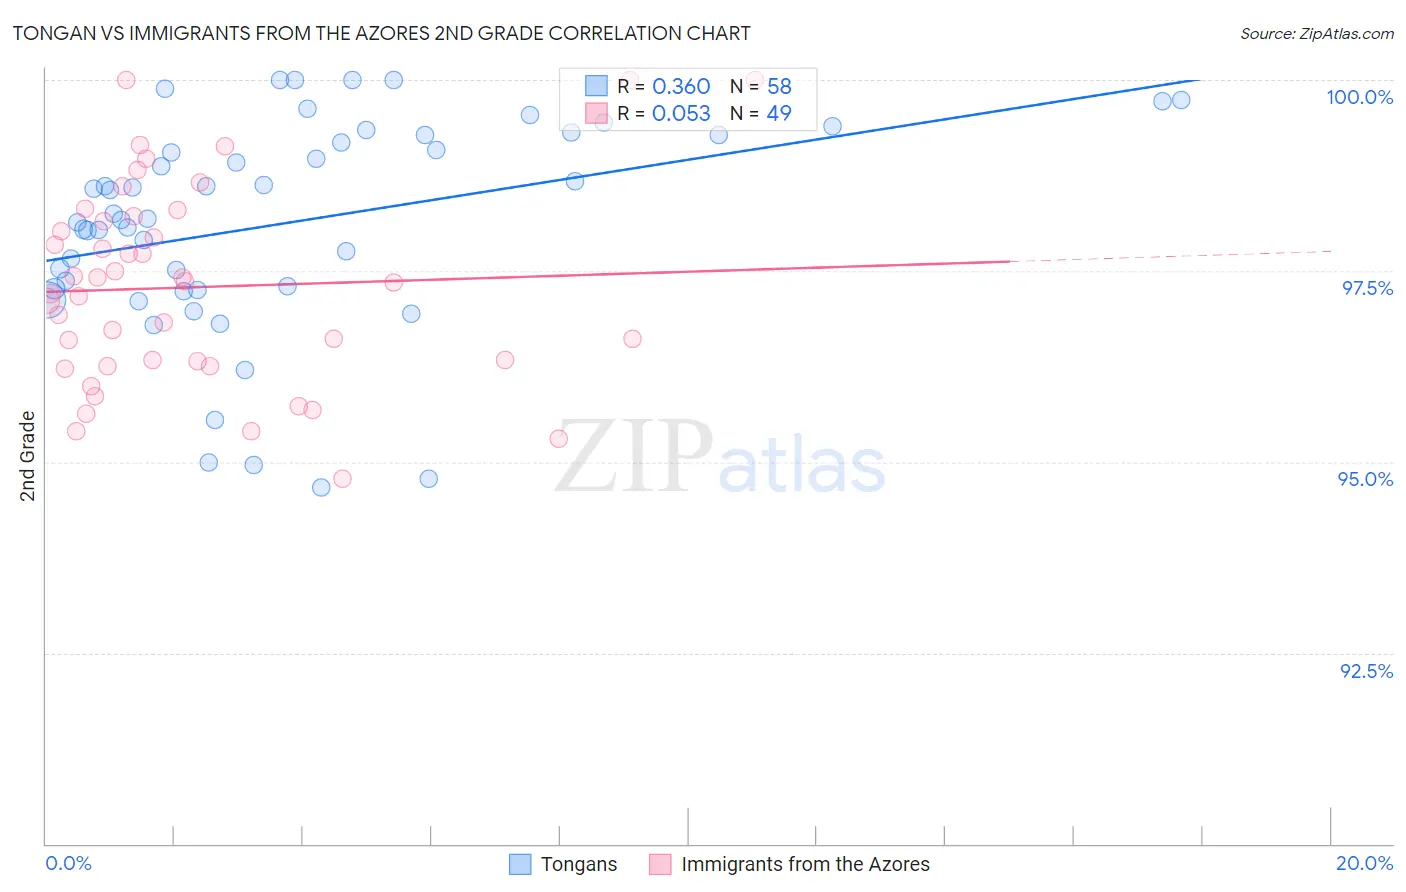
Tongan vs Immigrants from the Azores 2nd Grade Correlation Chart
The statistical analysis conducted on geographies consisting of 102,908,759 people shows a mild positive correlation between the proportion of Tongans and percentage of population with at least 2nd grade education in the United States with a correlation coefficient (R) of 0.360 and weighted average of 97.6%. Similarly, the statistical analysis conducted on geographies consisting of 46,257,310 people shows a slight positive correlation between the proportion of Immigrants from the Azores and percentage of population with at least 2nd grade education in the United States with a correlation coefficient (R) of 0.053 and weighted average of 96.8%, a difference of 0.81%.
2nd Grade Correlation Summary
| Measurement | Tongan | Immigrants from the Azores |
| Minimum | 94.7% | 94.8% |
| Maximum | 100.0% | 100.0% |
| Range | 5.3% | 5.2% |
| Mean | 98.1% | 97.3% |
| Median | 98.2% | 97.3% |
| Interquartile 25% (IQ1) | 97.3% | 96.3% |
| Interquartile 75% (IQ3) | 99.3% | 98.2% |
| Interquartile Range (IQR) | 2.0% | 1.9% |
| Standard Deviation (Sample) | 1.4% | 1.3% |
| Standard Deviation (Population) | 1.4% | 1.3% |
Similar Demographics by 2nd Grade
Demographics Similar to Tongans by 2nd Grade
In terms of 2nd grade, the demographic groups most similar to Tongans are Immigrants from Sudan (97.6%, a difference of 0.0%), Sierra Leonean (97.6%, a difference of 0.0%), Immigrants from Zaire (97.6%, a difference of 0.0%), Immigrants from Morocco (97.6%, a difference of 0.010%), and Iraqi (97.6%, a difference of 0.010%).
| Demographics | Rating | Rank | 2nd Grade |
| Sudanese | 5.7 /100 | #218 | Tragic 97.7% |
| Immigrants | Panama | 5.1 /100 | #219 | Tragic 97.6% |
| Immigrants | Morocco | 5.0 /100 | #220 | Tragic 97.6% |
| Iraqis | 4.6 /100 | #221 | Tragic 97.6% |
| Immigrants | Sudan | 4.5 /100 | #222 | Tragic 97.6% |
| Sierra Leoneans | 4.3 /100 | #223 | Tragic 97.6% |
| Immigrants | Zaire | 4.3 /100 | #224 | Tragic 97.6% |
| Tongans | 4.3 /100 | #225 | Tragic 97.6% |
| Immigrants | Syria | 4.0 /100 | #226 | Tragic 97.6% |
| Immigrants | Nepal | 4.0 /100 | #227 | Tragic 97.6% |
| Sub-Saharan Africans | 3.4 /100 | #228 | Tragic 97.6% |
| Immigrants | Costa Rica | 3.1 /100 | #229 | Tragic 97.6% |
| Senegalese | 3.1 /100 | #230 | Tragic 97.6% |
| Immigrants | Pakistan | 2.3 /100 | #231 | Tragic 97.6% |
| Immigrants | Western Asia | 2.1 /100 | #232 | Tragic 97.6% |
Demographics Similar to Immigrants from the Azores by 2nd Grade
In terms of 2nd grade, the demographic groups most similar to Immigrants from the Azores are Immigrants from Haiti (96.8%, a difference of 0.010%), Belizean (96.8%, a difference of 0.010%), Sri Lankan (96.8%, a difference of 0.020%), Guyanese (96.8%, a difference of 0.020%), and Immigrants from Somalia (96.9%, a difference of 0.030%).
| Demographics | Rating | Rank | 2nd Grade |
| Immigrants | South Eastern Asia | 0.0 /100 | #300 | Tragic 97.0% |
| Central American Indians | 0.0 /100 | #301 | Tragic 97.0% |
| Somalis | 0.0 /100 | #302 | Tragic 97.0% |
| Ecuadorians | 0.0 /100 | #303 | Tragic 96.9% |
| Immigrants | Caribbean | 0.0 /100 | #304 | Tragic 96.9% |
| Nicaraguans | 0.0 /100 | #305 | Tragic 96.9% |
| Immigrants | Somalia | 0.0 /100 | #306 | Tragic 96.9% |
| Immigrants | Azores | 0.0 /100 | #307 | Tragic 96.8% |
| Immigrants | Haiti | 0.0 /100 | #308 | Tragic 96.8% |
| Belizeans | 0.0 /100 | #309 | Tragic 96.8% |
| Sri Lankans | 0.0 /100 | #310 | Tragic 96.8% |
| Guyanese | 0.0 /100 | #311 | Tragic 96.8% |
| Cape Verdeans | 0.0 /100 | #312 | Tragic 96.8% |
| Hispanics or Latinos | 0.0 /100 | #313 | Tragic 96.8% |
| Immigrants | Ecuador | 0.0 /100 | #314 | Tragic 96.8% |