White/Caucasian vs Immigrants from the Azores 10th Grade
COMPARE
White/Caucasian
Immigrants from the Azores
10th Grade
10th Grade Comparison
Whites/Caucasians
Immigrants from the Azores
94.7%
10TH GRADE
98.8/ 100
METRIC RATING
91st/ 347
METRIC RANK
89.0%
10TH GRADE
0.0/ 100
METRIC RATING
332nd/ 347
METRIC RANK
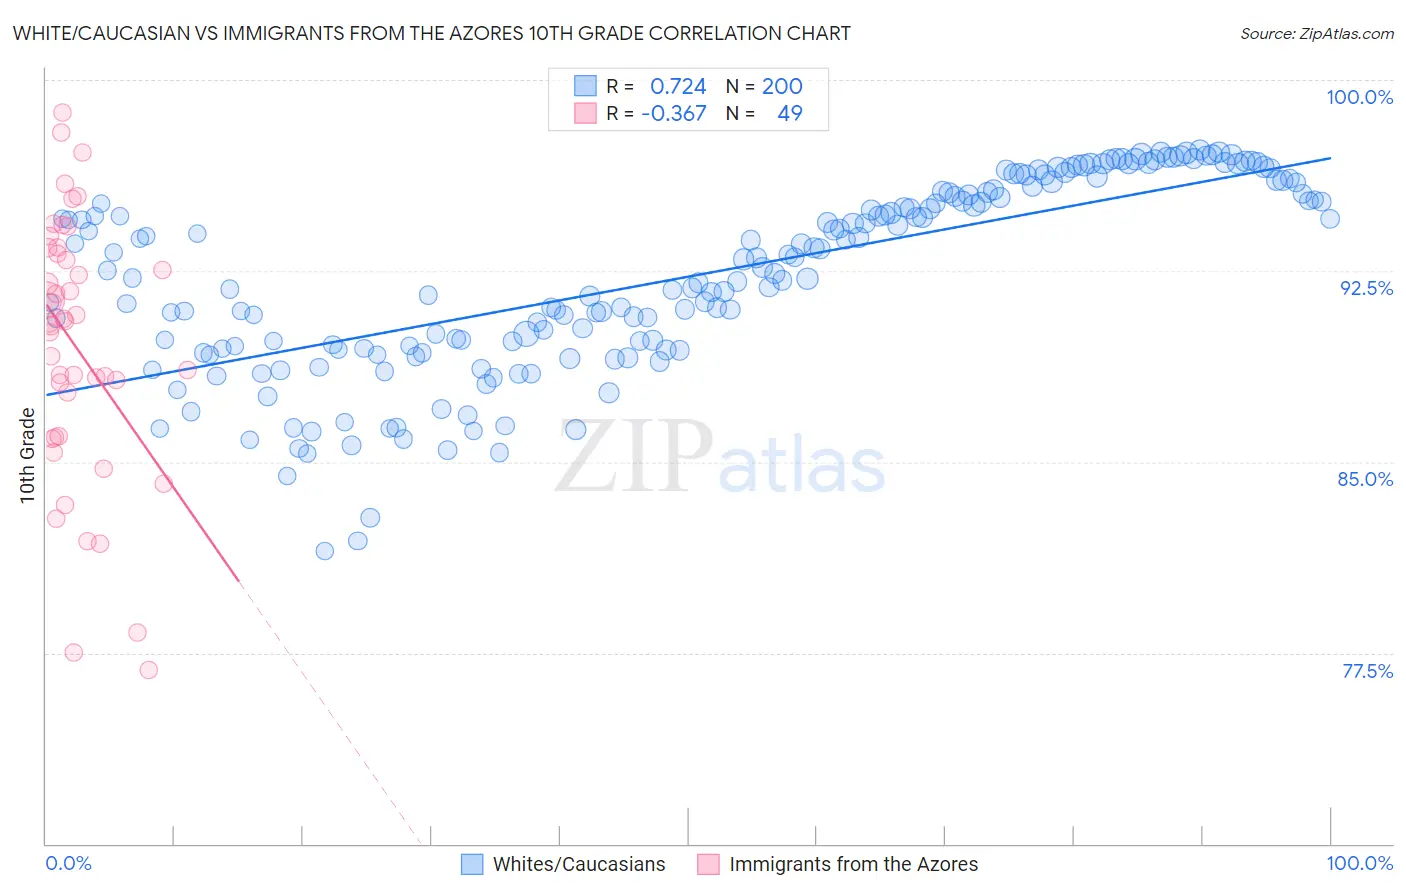
White/Caucasian vs Immigrants from the Azores 10th Grade Correlation Chart
The statistical analysis conducted on geographies consisting of 585,244,993 people shows a strong positive correlation between the proportion of Whites/Caucasians and percentage of population with at least 10th grade education in the United States with a correlation coefficient (R) of 0.724 and weighted average of 94.7%. Similarly, the statistical analysis conducted on geographies consisting of 46,257,310 people shows a mild negative correlation between the proportion of Immigrants from the Azores and percentage of population with at least 10th grade education in the United States with a correlation coefficient (R) of -0.367 and weighted average of 89.0%, a difference of 6.4%.
10th Grade Correlation Summary
| Measurement | White/Caucasian | Immigrants from the Azores |
| Minimum | 81.5% | 76.8% |
| Maximum | 97.2% | 98.7% |
| Range | 15.7% | 21.9% |
| Mean | 92.3% | 89.5% |
| Median | 92.6% | 90.5% |
| Interquartile 25% (IQ1) | 89.5% | 86.0% |
| Interquartile 75% (IQ3) | 95.5% | 93.3% |
| Interquartile Range (IQR) | 6.1% | 7.3% |
| Standard Deviation (Sample) | 3.7% | 5.1% |
| Standard Deviation (Population) | 3.7% | 5.1% |
Similar Demographics by 10th Grade
Demographics Similar to Whites/Caucasians by 10th Grade
In terms of 10th grade, the demographic groups most similar to Whites/Caucasians are South African (94.7%, a difference of 0.010%), Immigrants from Moldova (94.7%, a difference of 0.020%), Immigrants from Japan (94.7%, a difference of 0.030%), Immigrants from Saudi Arabia (94.7%, a difference of 0.040%), and Icelander (94.7%, a difference of 0.050%).
| Demographics | Rating | Rank | 10th Grade |
| Icelanders | 99.1 /100 | #84 | Exceptional 94.7% |
| Crow | 99.0 /100 | #85 | Exceptional 94.7% |
| Puget Sound Salish | 99.0 /100 | #86 | Exceptional 94.7% |
| Immigrants | Saudi Arabia | 99.0 /100 | #87 | Exceptional 94.7% |
| Immigrants | Japan | 99.0 /100 | #88 | Exceptional 94.7% |
| Immigrants | Moldova | 98.9 /100 | #89 | Exceptional 94.7% |
| South Africans | 98.8 /100 | #90 | Exceptional 94.7% |
| Whites/Caucasians | 98.8 /100 | #91 | Exceptional 94.7% |
| Yugoslavians | 98.4 /100 | #92 | Exceptional 94.6% |
| Soviet Union | 98.3 /100 | #93 | Exceptional 94.6% |
| Immigrants | Germany | 98.3 /100 | #94 | Exceptional 94.6% |
| Menominee | 98.3 /100 | #95 | Exceptional 94.6% |
| Immigrants | Switzerland | 98.3 /100 | #96 | Exceptional 94.6% |
| Lebanese | 98.3 /100 | #97 | Exceptional 94.6% |
| Immigrants | Bulgaria | 98.1 /100 | #98 | Exceptional 94.6% |
Demographics Similar to Immigrants from the Azores by 10th Grade
In terms of 10th grade, the demographic groups most similar to Immigrants from the Azores are Honduran (89.0%, a difference of 0.030%), Mexican American Indian (89.0%, a difference of 0.040%), Immigrants from Yemen (89.1%, a difference of 0.070%), Hispanic or Latino (88.9%, a difference of 0.15%), and Immigrants from Dominican Republic (88.7%, a difference of 0.33%).
| Demographics | Rating | Rank | 10th Grade |
| Puerto Ricans | 0.0 /100 | #325 | Tragic 89.8% |
| Central American Indians | 0.0 /100 | #326 | Tragic 89.7% |
| Immigrants | Nicaragua | 0.0 /100 | #327 | Tragic 89.5% |
| Immigrants | Cabo Verde | 0.0 /100 | #328 | Tragic 89.5% |
| Dominicans | 0.0 /100 | #329 | Tragic 89.4% |
| Immigrants | Yemen | 0.0 /100 | #330 | Tragic 89.1% |
| Mexican American Indians | 0.0 /100 | #331 | Tragic 89.0% |
| Immigrants | Azores | 0.0 /100 | #332 | Tragic 89.0% |
| Hondurans | 0.0 /100 | #333 | Tragic 89.0% |
| Hispanics or Latinos | 0.0 /100 | #334 | Tragic 88.9% |
| Immigrants | Dominican Republic | 0.0 /100 | #335 | Tragic 88.7% |
| Immigrants | Honduras | 0.0 /100 | #336 | Tragic 88.5% |
| Central Americans | 0.0 /100 | #337 | Tragic 88.4% |
| Immigrants | Latin America | 0.0 /100 | #338 | Tragic 88.3% |
| Guatemalans | 0.0 /100 | #339 | Tragic 87.9% |