Immigrants from Japan vs Immigrants from the Azores 10th Grade
COMPARE
Immigrants from Japan
Immigrants from the Azores
10th Grade
10th Grade Comparison
Immigrants from Japan
Immigrants from the Azores
94.7%
10TH GRADE
99.0/ 100
METRIC RATING
88th/ 347
METRIC RANK
89.0%
10TH GRADE
0.0/ 100
METRIC RATING
332nd/ 347
METRIC RANK
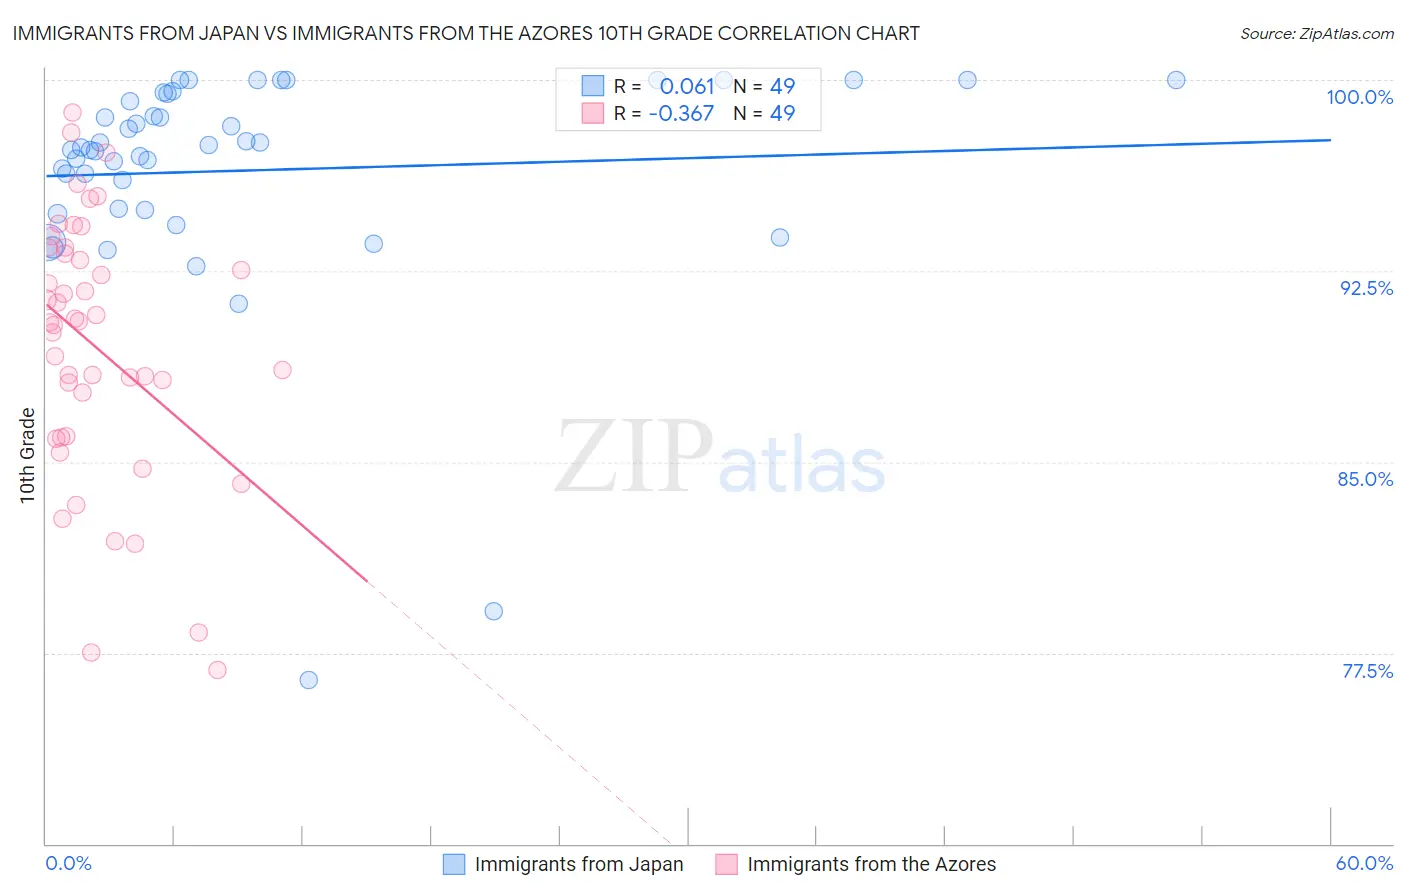
Immigrants from Japan vs Immigrants from the Azores 10th Grade Correlation Chart
The statistical analysis conducted on geographies consisting of 340,148,942 people shows a slight positive correlation between the proportion of Immigrants from Japan and percentage of population with at least 10th grade education in the United States with a correlation coefficient (R) of 0.061 and weighted average of 94.7%. Similarly, the statistical analysis conducted on geographies consisting of 46,257,310 people shows a mild negative correlation between the proportion of Immigrants from the Azores and percentage of population with at least 10th grade education in the United States with a correlation coefficient (R) of -0.367 and weighted average of 89.0%, a difference of 6.4%.
10th Grade Correlation Summary
| Measurement | Immigrants from Japan | Immigrants from the Azores |
| Minimum | 76.5% | 76.8% |
| Maximum | 100.0% | 98.7% |
| Range | 23.5% | 21.9% |
| Mean | 96.4% | 89.5% |
| Median | 97.3% | 90.5% |
| Interquartile 25% (IQ1) | 94.9% | 86.0% |
| Interquartile 75% (IQ3) | 99.5% | 93.3% |
| Interquartile Range (IQR) | 4.5% | 7.3% |
| Standard Deviation (Sample) | 4.5% | 5.1% |
| Standard Deviation (Population) | 4.5% | 5.1% |
Similar Demographics by 10th Grade
Demographics Similar to Immigrants from Japan by 10th Grade
In terms of 10th grade, the demographic groups most similar to Immigrants from Japan are Immigrants from Saudi Arabia (94.7%, a difference of 0.0%), Crow (94.7%, a difference of 0.010%), Puget Sound Salish (94.7%, a difference of 0.010%), Immigrants from Moldova (94.7%, a difference of 0.010%), and Icelander (94.7%, a difference of 0.020%).
| Demographics | Rating | Rank | 10th Grade |
| Immigrants | Latvia | 99.2 /100 | #81 | Exceptional 94.7% |
| Swiss | 99.1 /100 | #82 | Exceptional 94.7% |
| Immigrants | Western Europe | 99.1 /100 | #83 | Exceptional 94.7% |
| Icelanders | 99.1 /100 | #84 | Exceptional 94.7% |
| Crow | 99.0 /100 | #85 | Exceptional 94.7% |
| Puget Sound Salish | 99.0 /100 | #86 | Exceptional 94.7% |
| Immigrants | Saudi Arabia | 99.0 /100 | #87 | Exceptional 94.7% |
| Immigrants | Japan | 99.0 /100 | #88 | Exceptional 94.7% |
| Immigrants | Moldova | 98.9 /100 | #89 | Exceptional 94.7% |
| South Africans | 98.8 /100 | #90 | Exceptional 94.7% |
| Whites/Caucasians | 98.8 /100 | #91 | Exceptional 94.7% |
| Yugoslavians | 98.4 /100 | #92 | Exceptional 94.6% |
| Soviet Union | 98.3 /100 | #93 | Exceptional 94.6% |
| Immigrants | Germany | 98.3 /100 | #94 | Exceptional 94.6% |
| Menominee | 98.3 /100 | #95 | Exceptional 94.6% |
Demographics Similar to Immigrants from the Azores by 10th Grade
In terms of 10th grade, the demographic groups most similar to Immigrants from the Azores are Honduran (89.0%, a difference of 0.030%), Mexican American Indian (89.0%, a difference of 0.040%), Immigrants from Yemen (89.1%, a difference of 0.070%), Hispanic or Latino (88.9%, a difference of 0.15%), and Immigrants from Dominican Republic (88.7%, a difference of 0.33%).
| Demographics | Rating | Rank | 10th Grade |
| Puerto Ricans | 0.0 /100 | #325 | Tragic 89.8% |
| Central American Indians | 0.0 /100 | #326 | Tragic 89.7% |
| Immigrants | Nicaragua | 0.0 /100 | #327 | Tragic 89.5% |
| Immigrants | Cabo Verde | 0.0 /100 | #328 | Tragic 89.5% |
| Dominicans | 0.0 /100 | #329 | Tragic 89.4% |
| Immigrants | Yemen | 0.0 /100 | #330 | Tragic 89.1% |
| Mexican American Indians | 0.0 /100 | #331 | Tragic 89.0% |
| Immigrants | Azores | 0.0 /100 | #332 | Tragic 89.0% |
| Hondurans | 0.0 /100 | #333 | Tragic 89.0% |
| Hispanics or Latinos | 0.0 /100 | #334 | Tragic 88.9% |
| Immigrants | Dominican Republic | 0.0 /100 | #335 | Tragic 88.7% |
| Immigrants | Honduras | 0.0 /100 | #336 | Tragic 88.5% |
| Central Americans | 0.0 /100 | #337 | Tragic 88.4% |
| Immigrants | Latin America | 0.0 /100 | #338 | Tragic 88.3% |
| Guatemalans | 0.0 /100 | #339 | Tragic 87.9% |