Danish vs Soviet Union Professional Degree
COMPARE
Danish
Soviet Union
Professional Degree
Professional Degree Comparison
Danes
Soviet Union
4.4%
PROFESSIONAL DEGREE
43.5/ 100
METRIC RATING
181st/ 347
METRIC RANK
6.6%
PROFESSIONAL DEGREE
100.0/ 100
METRIC RATING
18th/ 347
METRIC RANK
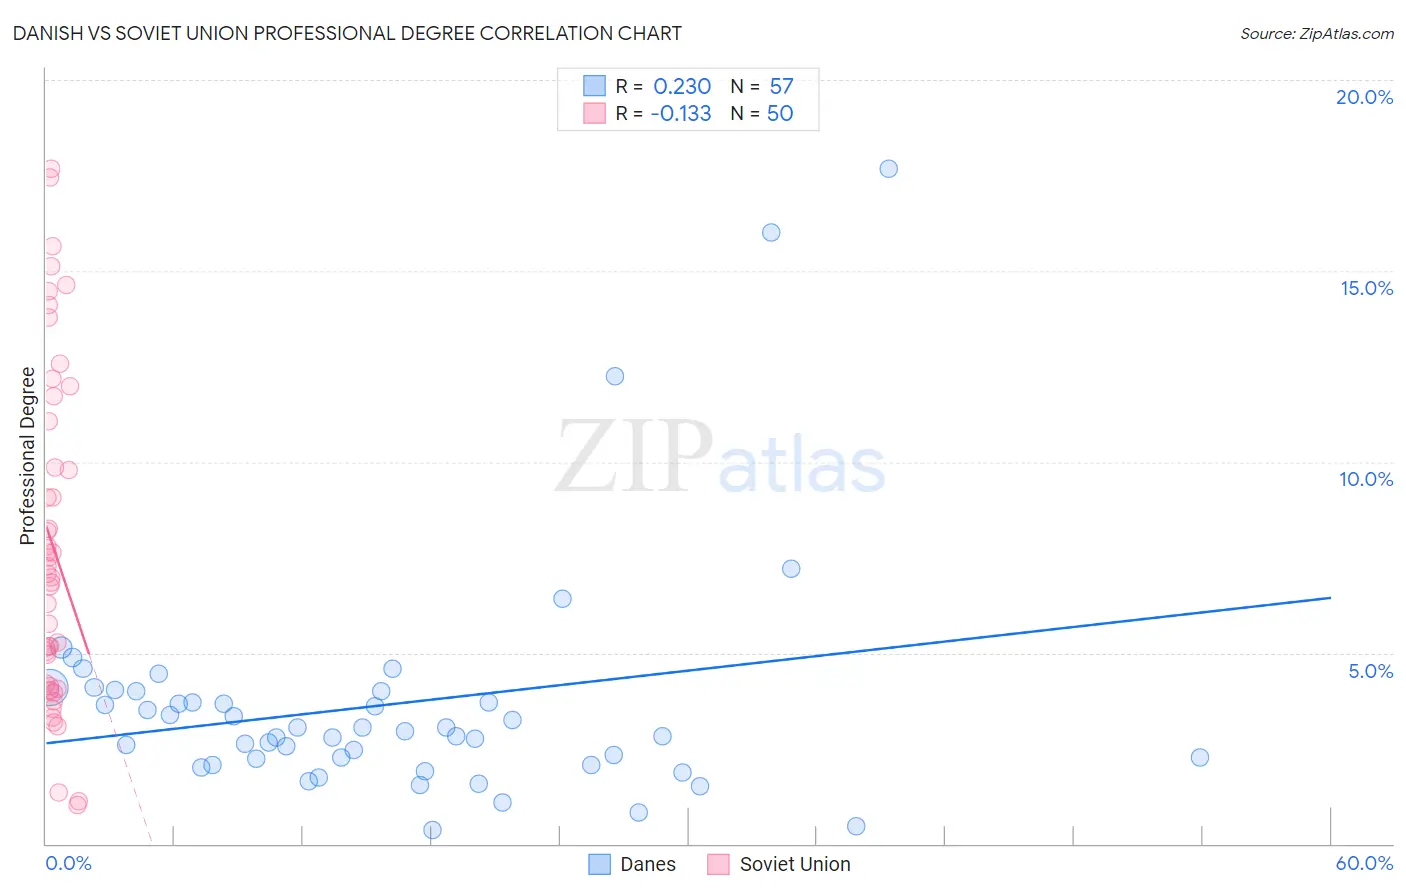
Danish vs Soviet Union Professional Degree Correlation Chart
The statistical analysis conducted on geographies consisting of 471,556,921 people shows a weak positive correlation between the proportion of Danes and percentage of population with at least professional degree education in the United States with a correlation coefficient (R) of 0.230 and weighted average of 4.4%. Similarly, the statistical analysis conducted on geographies consisting of 43,509,630 people shows a poor negative correlation between the proportion of Soviet Union and percentage of population with at least professional degree education in the United States with a correlation coefficient (R) of -0.133 and weighted average of 6.6%, a difference of 50.4%.
Professional Degree Correlation Summary
| Measurement | Danish | Soviet Union |
| Minimum | 0.37% | 1.0% |
| Maximum | 17.7% | 17.7% |
| Range | 17.3% | 16.7% |
| Mean | 3.6% | 7.8% |
| Median | 2.9% | 7.0% |
| Interquartile 25% (IQ1) | 2.1% | 4.1% |
| Interquartile 75% (IQ3) | 4.0% | 11.1% |
| Interquartile Range (IQR) | 1.8% | 6.9% |
| Standard Deviation (Sample) | 3.1% | 4.4% |
| Standard Deviation (Population) | 3.1% | 4.3% |
Similar Demographics by Professional Degree
Demographics Similar to Danes by Professional Degree
In terms of professional degree, the demographic groups most similar to Danes are Immigrants (4.4%, a difference of 0.040%), Bermudan (4.4%, a difference of 0.060%), Czech (4.4%, a difference of 0.22%), Immigrants from Kenya (4.4%, a difference of 0.36%), and Immigrants from Costa Rica (4.4%, a difference of 0.47%).
| Demographics | Rating | Rank | Professional Degree |
| Kenyans | 50.0 /100 | #174 | Average 4.4% |
| Irish | 50.0 /100 | #175 | Average 4.4% |
| Immigrants | Peru | 49.3 /100 | #176 | Average 4.4% |
| Celtics | 47.6 /100 | #177 | Average 4.4% |
| Immigrants | Costa Rica | 46.7 /100 | #178 | Average 4.4% |
| Immigrants | Kenya | 45.9 /100 | #179 | Average 4.4% |
| Czechs | 44.9 /100 | #180 | Average 4.4% |
| Danes | 43.5 /100 | #181 | Average 4.4% |
| Immigrants | Immigrants | 43.2 /100 | #182 | Average 4.4% |
| Bermudans | 43.1 /100 | #183 | Average 4.4% |
| Belgians | 36.2 /100 | #184 | Fair 4.3% |
| Welsh | 35.8 /100 | #185 | Fair 4.3% |
| Scotch-Irish | 34.2 /100 | #186 | Fair 4.3% |
| Immigrants | Cameroon | 33.3 /100 | #187 | Fair 4.3% |
| Immigrants | Thailand | 31.7 /100 | #188 | Fair 4.3% |
Demographics Similar to Soviet Union by Professional Degree
In terms of professional degree, the demographic groups most similar to Soviet Union are Immigrants from Eastern Asia (6.6%, a difference of 0.020%), Indian (Asian) (6.5%, a difference of 0.66%), Immigrants from Sweden (6.7%, a difference of 2.0%), Immigrants from Denmark (6.4%, a difference of 2.2%), and Immigrants from Hong Kong (6.4%, a difference of 2.4%).
| Demographics | Rating | Rank | Professional Degree |
| Cypriots | 100.0 /100 | #11 | Exceptional 6.9% |
| Israelis | 100.0 /100 | #12 | Exceptional 6.9% |
| Immigrants | Australia | 100.0 /100 | #13 | Exceptional 6.9% |
| Immigrants | France | 100.0 /100 | #14 | Exceptional 6.8% |
| Immigrants | China | 100.0 /100 | #15 | Exceptional 6.7% |
| Immigrants | Sweden | 100.0 /100 | #16 | Exceptional 6.7% |
| Immigrants | Eastern Asia | 100.0 /100 | #17 | Exceptional 6.6% |
| Soviet Union | 100.0 /100 | #18 | Exceptional 6.6% |
| Indians (Asian) | 100.0 /100 | #19 | Exceptional 6.5% |
| Immigrants | Denmark | 100.0 /100 | #20 | Exceptional 6.4% |
| Immigrants | Hong Kong | 100.0 /100 | #21 | Exceptional 6.4% |
| Immigrants | Japan | 100.0 /100 | #22 | Exceptional 6.4% |
| Russians | 100.0 /100 | #23 | Exceptional 6.3% |
| Immigrants | Spain | 100.0 /100 | #24 | Exceptional 6.3% |
| Immigrants | Ireland | 100.0 /100 | #25 | Exceptional 6.3% |