Immigrants from Bahamas vs Soviet Union Professional Degree
COMPARE
Immigrants from Bahamas
Soviet Union
Professional Degree
Professional Degree Comparison
Immigrants from Bahamas
Soviet Union
3.8%
PROFESSIONAL DEGREE
2.0/ 100
METRIC RATING
244th/ 347
METRIC RANK
6.6%
PROFESSIONAL DEGREE
100.0/ 100
METRIC RATING
18th/ 347
METRIC RANK
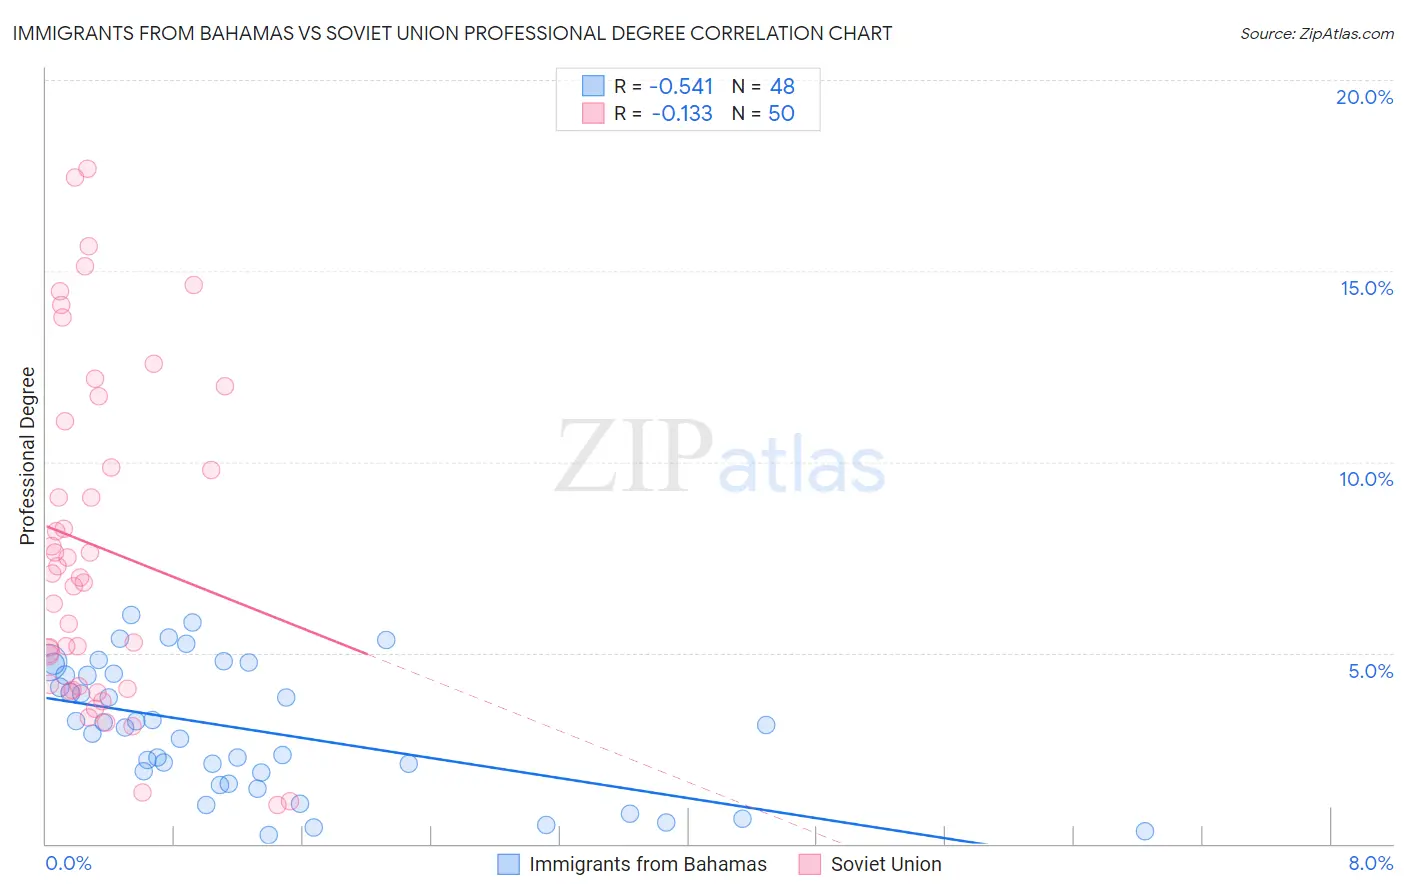
Immigrants from Bahamas vs Soviet Union Professional Degree Correlation Chart
The statistical analysis conducted on geographies consisting of 104,591,869 people shows a substantial negative correlation between the proportion of Immigrants from Bahamas and percentage of population with at least professional degree education in the United States with a correlation coefficient (R) of -0.541 and weighted average of 3.8%. Similarly, the statistical analysis conducted on geographies consisting of 43,509,630 people shows a poor negative correlation between the proportion of Soviet Union and percentage of population with at least professional degree education in the United States with a correlation coefficient (R) of -0.133 and weighted average of 6.6%, a difference of 73.5%.
Professional Degree Correlation Summary
| Measurement | Immigrants from Bahamas | Soviet Union |
| Minimum | 0.24% | 1.0% |
| Maximum | 6.0% | 17.7% |
| Range | 5.7% | 16.7% |
| Mean | 3.0% | 7.8% |
| Median | 3.1% | 7.0% |
| Interquartile 25% (IQ1) | 1.7% | 4.1% |
| Interquartile 75% (IQ3) | 4.4% | 11.1% |
| Interquartile Range (IQR) | 2.7% | 6.9% |
| Standard Deviation (Sample) | 1.7% | 4.4% |
| Standard Deviation (Population) | 1.6% | 4.3% |
Similar Demographics by Professional Degree
Demographics Similar to Immigrants from Bahamas by Professional Degree
In terms of professional degree, the demographic groups most similar to Immigrants from Bahamas are Guamanian/Chamorro (3.8%, a difference of 0.43%), Alaskan Athabascan (3.8%, a difference of 0.51%), Native Hawaiian (3.8%, a difference of 0.51%), Immigrants from Ecuador (3.8%, a difference of 0.53%), and French American Indian (3.8%, a difference of 0.70%).
| Demographics | Rating | Rank | Professional Degree |
| Immigrants | Trinidad and Tobago | 3.8 /100 | #237 | Tragic 3.9% |
| Colville | 2.6 /100 | #238 | Tragic 3.8% |
| British West Indians | 2.4 /100 | #239 | Tragic 3.8% |
| Immigrants | Ecuador | 2.3 /100 | #240 | Tragic 3.8% |
| Alaskan Athabascans | 2.3 /100 | #241 | Tragic 3.8% |
| Native Hawaiians | 2.3 /100 | #242 | Tragic 3.8% |
| Guamanians/Chamorros | 2.2 /100 | #243 | Tragic 3.8% |
| Immigrants | Bahamas | 2.0 /100 | #244 | Tragic 3.8% |
| French American Indians | 1.7 /100 | #245 | Tragic 3.8% |
| Marshallese | 1.7 /100 | #246 | Tragic 3.8% |
| Guyanese | 1.6 /100 | #247 | Tragic 3.8% |
| Hmong | 1.6 /100 | #248 | Tragic 3.7% |
| Immigrants | Grenada | 1.5 /100 | #249 | Tragic 3.7% |
| Immigrants | Fiji | 1.5 /100 | #250 | Tragic 3.7% |
| Immigrants | Nicaragua | 1.4 /100 | #251 | Tragic 3.7% |
Demographics Similar to Soviet Union by Professional Degree
In terms of professional degree, the demographic groups most similar to Soviet Union are Immigrants from Eastern Asia (6.6%, a difference of 0.020%), Indian (Asian) (6.5%, a difference of 0.66%), Immigrants from Sweden (6.7%, a difference of 2.0%), Immigrants from Denmark (6.4%, a difference of 2.2%), and Immigrants from Hong Kong (6.4%, a difference of 2.4%).
| Demographics | Rating | Rank | Professional Degree |
| Cypriots | 100.0 /100 | #11 | Exceptional 6.9% |
| Israelis | 100.0 /100 | #12 | Exceptional 6.9% |
| Immigrants | Australia | 100.0 /100 | #13 | Exceptional 6.9% |
| Immigrants | France | 100.0 /100 | #14 | Exceptional 6.8% |
| Immigrants | China | 100.0 /100 | #15 | Exceptional 6.7% |
| Immigrants | Sweden | 100.0 /100 | #16 | Exceptional 6.7% |
| Immigrants | Eastern Asia | 100.0 /100 | #17 | Exceptional 6.6% |
| Soviet Union | 100.0 /100 | #18 | Exceptional 6.6% |
| Indians (Asian) | 100.0 /100 | #19 | Exceptional 6.5% |
| Immigrants | Denmark | 100.0 /100 | #20 | Exceptional 6.4% |
| Immigrants | Hong Kong | 100.0 /100 | #21 | Exceptional 6.4% |
| Immigrants | Japan | 100.0 /100 | #22 | Exceptional 6.4% |
| Russians | 100.0 /100 | #23 | Exceptional 6.3% |
| Immigrants | Spain | 100.0 /100 | #24 | Exceptional 6.3% |
| Immigrants | Ireland | 100.0 /100 | #25 | Exceptional 6.3% |