Tlingit-Haida vs Immigrants from Morocco Professional Degree
COMPARE
Tlingit-Haida
Immigrants from Morocco
Professional Degree
Professional Degree Comparison
Tlingit-Haida
Immigrants from Morocco
4.0%
PROFESSIONAL DEGREE
6.9/ 100
METRIC RATING
225th/ 347
METRIC RANK
5.0%
PROFESSIONAL DEGREE
96.8/ 100
METRIC RATING
114th/ 347
METRIC RANK
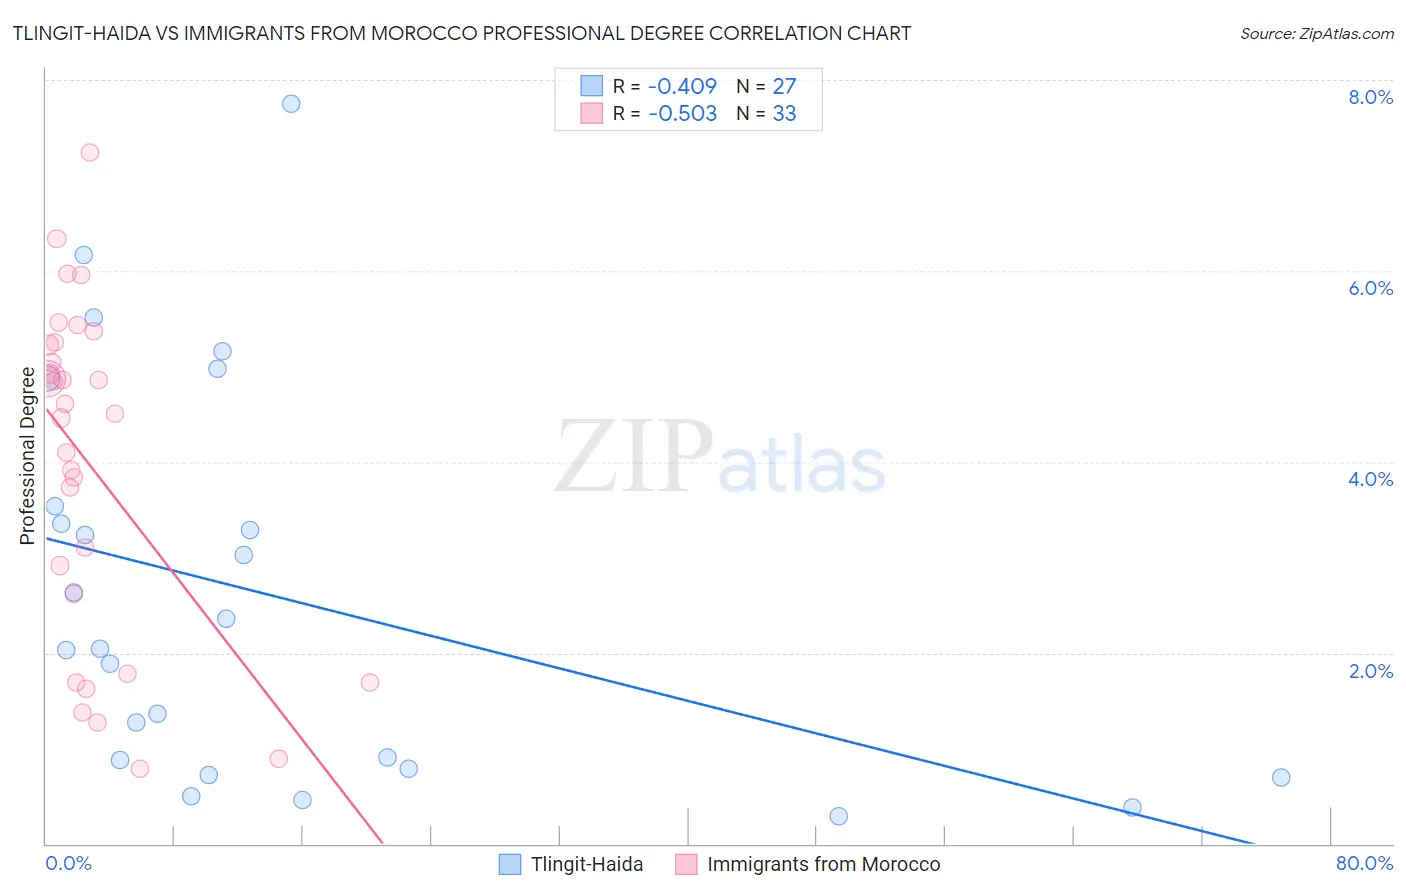
Tlingit-Haida vs Immigrants from Morocco Professional Degree Correlation Chart
The statistical analysis conducted on geographies consisting of 60,804,228 people shows a moderate negative correlation between the proportion of Tlingit-Haida and percentage of population with at least professional degree education in the United States with a correlation coefficient (R) of -0.409 and weighted average of 4.0%. Similarly, the statistical analysis conducted on geographies consisting of 178,862,837 people shows a substantial negative correlation between the proportion of Immigrants from Morocco and percentage of population with at least professional degree education in the United States with a correlation coefficient (R) of -0.503 and weighted average of 5.0%, a difference of 24.2%.
Professional Degree Correlation Summary
| Measurement | Tlingit-Haida | Immigrants from Morocco |
| Minimum | 0.29% | 0.78% |
| Maximum | 7.8% | 7.2% |
| Range | 7.5% | 6.4% |
| Mean | 2.6% | 4.0% |
| Median | 2.0% | 4.5% |
| Interquartile 25% (IQ1) | 0.79% | 2.2% |
| Interquartile 75% (IQ3) | 3.5% | 5.2% |
| Interquartile Range (IQR) | 2.7% | 3.0% |
| Standard Deviation (Sample) | 2.0% | 1.8% |
| Standard Deviation (Population) | 2.0% | 1.7% |
Similar Demographics by Professional Degree
Demographics Similar to Tlingit-Haida by Professional Degree
In terms of professional degree, the demographic groups most similar to Tlingit-Haida are Trinidadian and Tobagonian (4.0%, a difference of 0.13%), Immigrants from Bosnia and Herzegovina (4.0%, a difference of 0.27%), Immigrants from Western Africa (4.0%, a difference of 0.35%), German Russian (4.0%, a difference of 0.55%), and French Canadian (4.0%, a difference of 0.60%).
| Demographics | Rating | Rank | Professional Degree |
| Dutch | 9.0 /100 | #218 | Tragic 4.0% |
| Immigrants | South Eastern Asia | 8.9 /100 | #219 | Tragic 4.0% |
| Ute | 8.2 /100 | #220 | Tragic 4.0% |
| French Canadians | 8.0 /100 | #221 | Tragic 4.0% |
| Immigrants | Western Africa | 7.5 /100 | #222 | Tragic 4.0% |
| Immigrants | Bosnia and Herzegovina | 7.4 /100 | #223 | Tragic 4.0% |
| Trinidadians and Tobagonians | 7.1 /100 | #224 | Tragic 4.0% |
| Tlingit-Haida | 6.9 /100 | #225 | Tragic 4.0% |
| German Russians | 6.1 /100 | #226 | Tragic 4.0% |
| Cubans | 5.9 /100 | #227 | Tragic 4.0% |
| Immigrants | West Indies | 5.6 /100 | #228 | Tragic 4.0% |
| Immigrants | Burma/Myanmar | 5.4 /100 | #229 | Tragic 3.9% |
| Nicaraguans | 5.1 /100 | #230 | Tragic 3.9% |
| Ecuadorians | 4.6 /100 | #231 | Tragic 3.9% |
| Cree | 4.3 /100 | #232 | Tragic 3.9% |
Demographics Similar to Immigrants from Morocco by Professional Degree
In terms of professional degree, the demographic groups most similar to Immigrants from Morocco are Moroccan (5.0%, a difference of 0.10%), Immigrants from Pakistan (5.0%, a difference of 0.45%), Taiwanese (5.0%, a difference of 0.47%), Venezuelan (4.9%, a difference of 0.57%), and Brazilian (5.0%, a difference of 0.69%).
| Demographics | Rating | Rank | Professional Degree |
| Maltese | 98.1 /100 | #107 | Exceptional 5.0% |
| Immigrants | Southern Europe | 98.1 /100 | #108 | Exceptional 5.0% |
| British | 98.0 /100 | #109 | Exceptional 5.0% |
| Lebanese | 98.0 /100 | #110 | Exceptional 5.0% |
| Brazilians | 97.4 /100 | #111 | Exceptional 5.0% |
| Taiwanese | 97.3 /100 | #112 | Exceptional 5.0% |
| Immigrants | Pakistan | 97.2 /100 | #113 | Exceptional 5.0% |
| Immigrants | Morocco | 96.8 /100 | #114 | Exceptional 5.0% |
| Moroccans | 96.8 /100 | #115 | Exceptional 5.0% |
| Venezuelans | 96.3 /100 | #116 | Exceptional 4.9% |
| Immigrants | Syria | 96.0 /100 | #117 | Exceptional 4.9% |
| Croatians | 96.0 /100 | #118 | Exceptional 4.9% |
| Immigrants | Sudan | 95.4 /100 | #119 | Exceptional 4.9% |
| Albanians | 95.3 /100 | #120 | Exceptional 4.9% |
| Immigrants | Moldova | 94.8 /100 | #121 | Exceptional 4.9% |