Ottawa vs Soviet Union Professional Degree
COMPARE
Ottawa
Soviet Union
Professional Degree
Professional Degree Comparison
Ottawa
Soviet Union
3.4%
PROFESSIONAL DEGREE
0.2/ 100
METRIC RATING
298th/ 347
METRIC RANK
6.6%
PROFESSIONAL DEGREE
100.0/ 100
METRIC RATING
18th/ 347
METRIC RANK
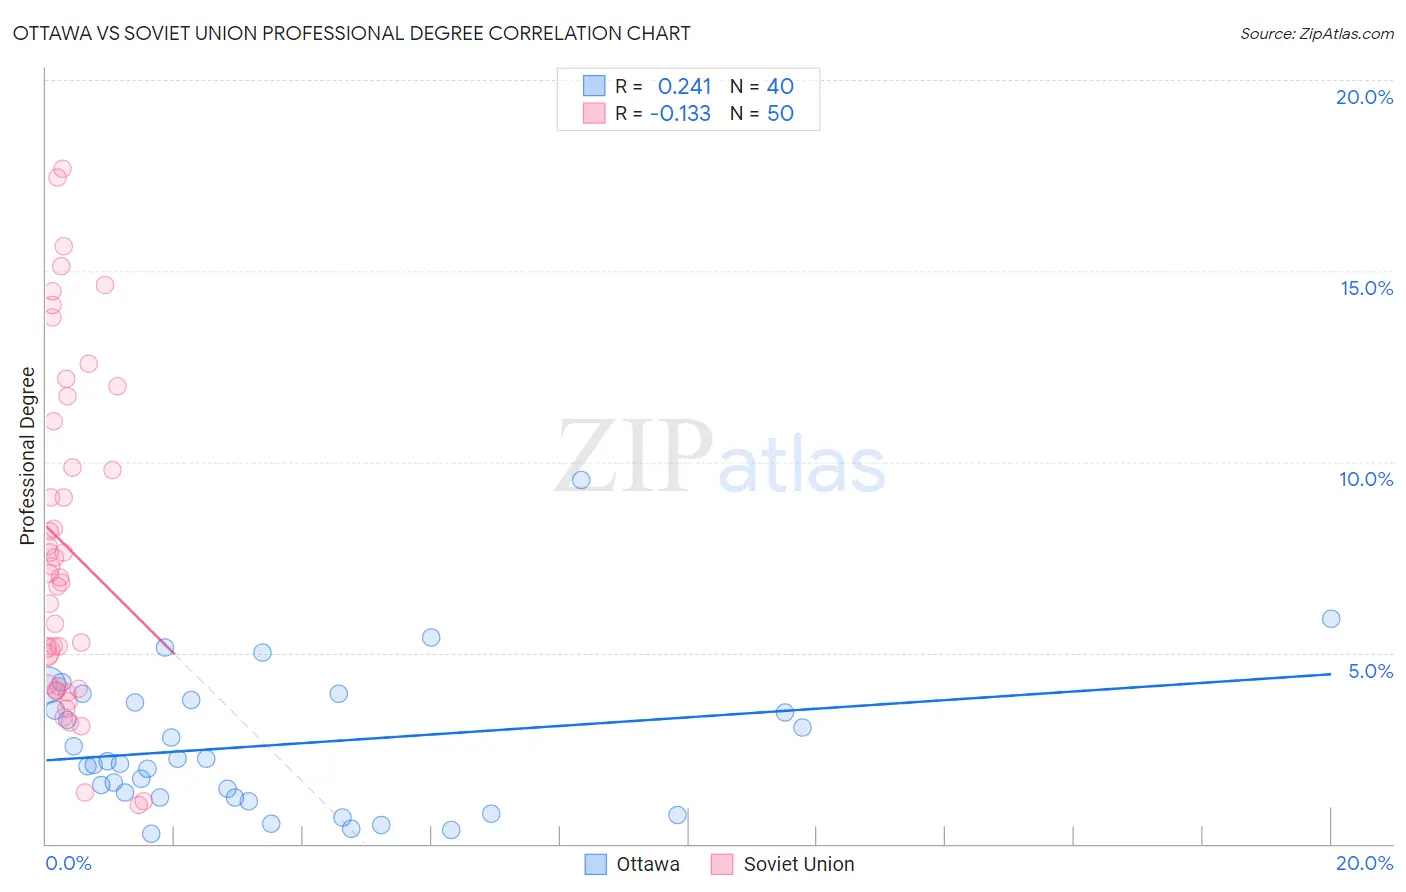
Ottawa vs Soviet Union Professional Degree Correlation Chart
The statistical analysis conducted on geographies consisting of 49,856,239 people shows a weak positive correlation between the proportion of Ottawa and percentage of population with at least professional degree education in the United States with a correlation coefficient (R) of 0.241 and weighted average of 3.4%. Similarly, the statistical analysis conducted on geographies consisting of 43,509,630 people shows a poor negative correlation between the proportion of Soviet Union and percentage of population with at least professional degree education in the United States with a correlation coefficient (R) of -0.133 and weighted average of 6.6%, a difference of 91.4%.
Professional Degree Correlation Summary
| Measurement | Ottawa | Soviet Union |
| Minimum | 0.25% | 1.0% |
| Maximum | 9.5% | 17.7% |
| Range | 9.3% | 16.7% |
| Mean | 2.6% | 7.8% |
| Median | 2.1% | 7.0% |
| Interquartile 25% (IQ1) | 1.2% | 4.1% |
| Interquartile 75% (IQ3) | 3.7% | 11.1% |
| Interquartile Range (IQR) | 2.5% | 6.9% |
| Standard Deviation (Sample) | 1.9% | 4.4% |
| Standard Deviation (Population) | 1.9% | 4.3% |
Similar Demographics by Professional Degree
Demographics Similar to Ottawa by Professional Degree
In terms of professional degree, the demographic groups most similar to Ottawa are Immigrants from Liberia (3.4%, a difference of 0.050%), Hawaiian (3.4%, a difference of 0.39%), Immigrants from Guatemala (3.4%, a difference of 0.40%), Paiute (3.4%, a difference of 0.56%), and Immigrants from Honduras (3.5%, a difference of 0.64%).
| Demographics | Rating | Rank | Professional Degree |
| Alaska Natives | 0.3 /100 | #291 | Tragic 3.5% |
| Immigrants | Belize | 0.3 /100 | #292 | Tragic 3.5% |
| Immigrants | Honduras | 0.3 /100 | #293 | Tragic 3.5% |
| Paiute | 0.3 /100 | #294 | Tragic 3.4% |
| Immigrants | Guatemala | 0.2 /100 | #295 | Tragic 3.4% |
| Hawaiians | 0.2 /100 | #296 | Tragic 3.4% |
| Immigrants | Liberia | 0.2 /100 | #297 | Tragic 3.4% |
| Ottawa | 0.2 /100 | #298 | Tragic 3.4% |
| Immigrants | Yemen | 0.2 /100 | #299 | Tragic 3.4% |
| Blacks/African Americans | 0.2 /100 | #300 | Tragic 3.4% |
| Immigrants | Dominican Republic | 0.2 /100 | #301 | Tragic 3.4% |
| Malaysians | 0.2 /100 | #302 | Tragic 3.4% |
| Immigrants | Haiti | 0.2 /100 | #303 | Tragic 3.4% |
| Cajuns | 0.2 /100 | #304 | Tragic 3.4% |
| Chickasaw | 0.1 /100 | #305 | Tragic 3.4% |
Demographics Similar to Soviet Union by Professional Degree
In terms of professional degree, the demographic groups most similar to Soviet Union are Immigrants from Eastern Asia (6.6%, a difference of 0.020%), Indian (Asian) (6.5%, a difference of 0.66%), Immigrants from Sweden (6.7%, a difference of 2.0%), Immigrants from Denmark (6.4%, a difference of 2.2%), and Immigrants from Hong Kong (6.4%, a difference of 2.4%).
| Demographics | Rating | Rank | Professional Degree |
| Cypriots | 100.0 /100 | #11 | Exceptional 6.9% |
| Israelis | 100.0 /100 | #12 | Exceptional 6.9% |
| Immigrants | Australia | 100.0 /100 | #13 | Exceptional 6.9% |
| Immigrants | France | 100.0 /100 | #14 | Exceptional 6.8% |
| Immigrants | China | 100.0 /100 | #15 | Exceptional 6.7% |
| Immigrants | Sweden | 100.0 /100 | #16 | Exceptional 6.7% |
| Immigrants | Eastern Asia | 100.0 /100 | #17 | Exceptional 6.6% |
| Soviet Union | 100.0 /100 | #18 | Exceptional 6.6% |
| Indians (Asian) | 100.0 /100 | #19 | Exceptional 6.5% |
| Immigrants | Denmark | 100.0 /100 | #20 | Exceptional 6.4% |
| Immigrants | Hong Kong | 100.0 /100 | #21 | Exceptional 6.4% |
| Immigrants | Japan | 100.0 /100 | #22 | Exceptional 6.4% |
| Russians | 100.0 /100 | #23 | Exceptional 6.3% |
| Immigrants | Spain | 100.0 /100 | #24 | Exceptional 6.3% |
| Immigrants | Ireland | 100.0 /100 | #25 | Exceptional 6.3% |