Argentinean vs Immigrants from Fiji No Schooling Completed
COMPARE
Argentinean
Immigrants from Fiji
No Schooling Completed
No Schooling Completed Comparison
Argentineans
Immigrants from Fiji
2.1%
NO SCHOOLING COMPLETED
56.0/ 100
METRIC RATING
170th/ 347
METRIC RANK
3.5%
NO SCHOOLING COMPLETED
0.0/ 100
METRIC RATING
336th/ 347
METRIC RANK
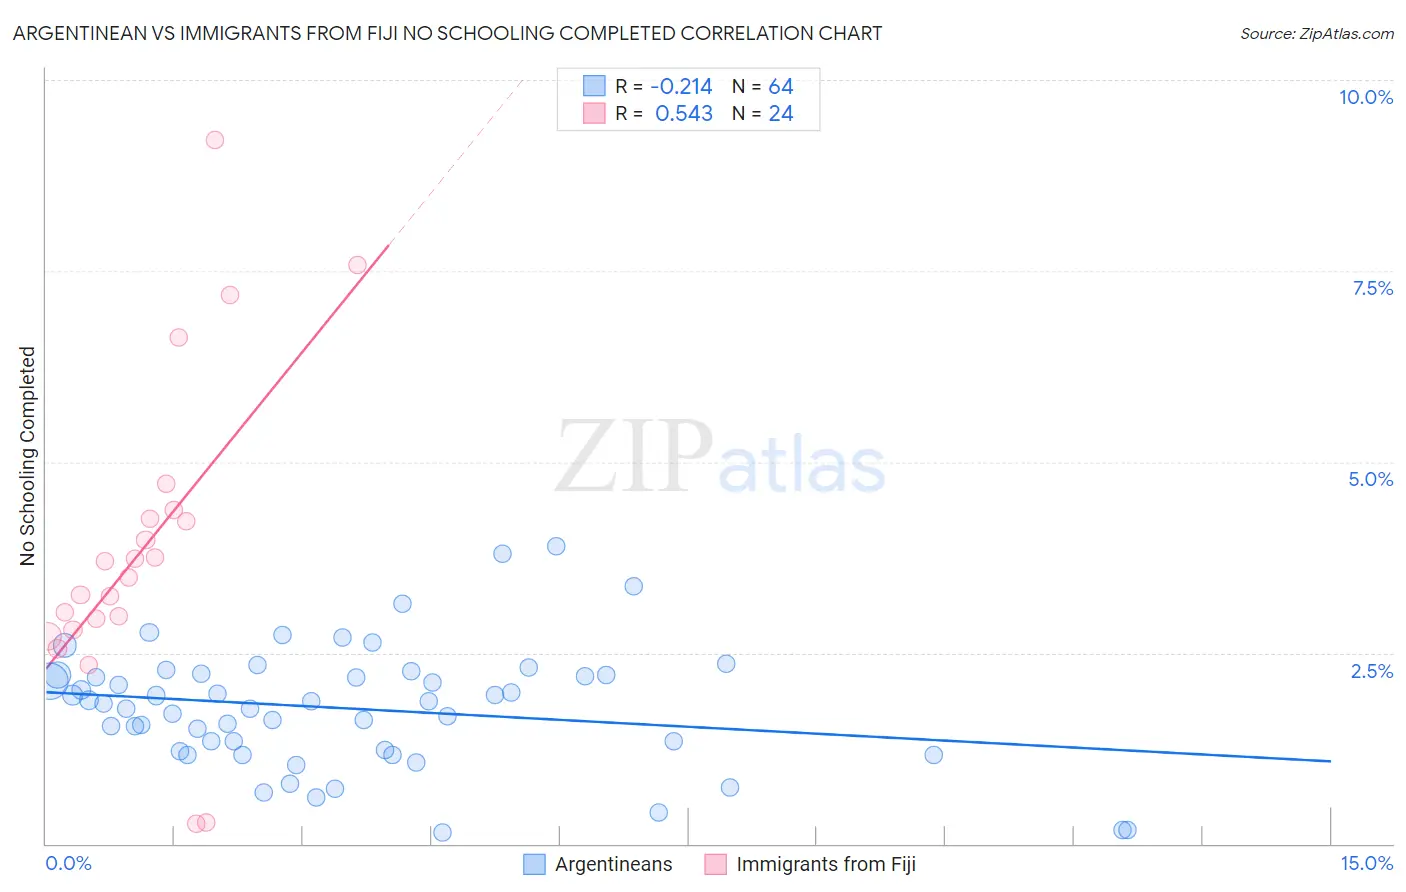
Argentinean vs Immigrants from Fiji No Schooling Completed Correlation Chart
The statistical analysis conducted on geographies consisting of 295,019,263 people shows a weak negative correlation between the proportion of Argentineans and percentage of population with no schooling in the United States with a correlation coefficient (R) of -0.214 and weighted average of 2.1%. Similarly, the statistical analysis conducted on geographies consisting of 93,588,914 people shows a substantial positive correlation between the proportion of Immigrants from Fiji and percentage of population with no schooling in the United States with a correlation coefficient (R) of 0.543 and weighted average of 3.5%, a difference of 69.1%.
No Schooling Completed Correlation Summary
| Measurement | Argentinean | Immigrants from Fiji |
| Minimum | 0.14% | 0.26% |
| Maximum | 3.9% | 9.2% |
| Range | 3.7% | 9.0% |
| Mean | 1.8% | 3.9% |
| Median | 1.8% | 3.6% |
| Interquartile 25% (IQ1) | 1.2% | 2.9% |
| Interquartile 75% (IQ3) | 2.2% | 4.3% |
| Interquartile Range (IQR) | 0.99% | 1.4% |
| Standard Deviation (Sample) | 0.79% | 2.1% |
| Standard Deviation (Population) | 0.79% | 2.0% |
Similar Demographics by No Schooling Completed
Demographics Similar to Argentineans by No Schooling Completed
In terms of no schooling completed, the demographic groups most similar to Argentineans are Apache (2.1%, a difference of 0.090%), Immigrants from Poland (2.1%, a difference of 0.11%), Cheyenne (2.1%, a difference of 0.36%), Egyptian (2.1%, a difference of 0.44%), and Immigrants from Argentina (2.1%, a difference of 0.45%).
| Demographics | Rating | Rank | No Schooling Completed |
| Albanians | 62.2 /100 | #163 | Good 2.1% |
| Comanche | 60.7 /100 | #164 | Good 2.1% |
| Brazilians | 60.2 /100 | #165 | Good 2.1% |
| Dutch West Indians | 59.9 /100 | #166 | Average 2.1% |
| Egyptians | 59.2 /100 | #167 | Average 2.1% |
| Cheyenne | 58.6 /100 | #168 | Average 2.1% |
| Apache | 56.7 /100 | #169 | Average 2.1% |
| Argentineans | 56.0 /100 | #170 | Average 2.1% |
| Immigrants | Poland | 55.2 /100 | #171 | Average 2.1% |
| Immigrants | Argentina | 52.7 /100 | #172 | Average 2.1% |
| Immigrants | Belarus | 51.8 /100 | #173 | Average 2.1% |
| Immigrants | Micronesia | 50.0 /100 | #174 | Average 2.1% |
| Arabs | 46.4 /100 | #175 | Average 2.1% |
| Panamanians | 45.2 /100 | #176 | Average 2.1% |
| Arapaho | 45.0 /100 | #177 | Average 2.1% |
Demographics Similar to Immigrants from Fiji by No Schooling Completed
In terms of no schooling completed, the demographic groups most similar to Immigrants from Fiji are Immigrants from Cambodia (3.5%, a difference of 0.37%), Immigrants from Cabo Verde (3.5%, a difference of 0.71%), Bangladeshi (3.5%, a difference of 0.95%), Yakama (3.6%, a difference of 1.3%), and Guatemalan (3.5%, a difference of 1.4%).
| Demographics | Rating | Rank | No Schooling Completed |
| Immigrants | Vietnam | 0.0 /100 | #329 | Tragic 3.3% |
| Immigrants | Armenia | 0.0 /100 | #330 | Tragic 3.3% |
| Japanese | 0.0 /100 | #331 | Tragic 3.3% |
| Central Americans | 0.0 /100 | #332 | Tragic 3.4% |
| Immigrants | Dominican Republic | 0.0 /100 | #333 | Tragic 3.4% |
| Guatemalans | 0.0 /100 | #334 | Tragic 3.5% |
| Immigrants | Cambodia | 0.0 /100 | #335 | Tragic 3.5% |
| Immigrants | Fiji | 0.0 /100 | #336 | Tragic 3.5% |
| Immigrants | Cabo Verde | 0.0 /100 | #337 | Tragic 3.5% |
| Bangladeshis | 0.0 /100 | #338 | Tragic 3.5% |
| Yakama | 0.0 /100 | #339 | Tragic 3.6% |
| Immigrants | Guatemala | 0.0 /100 | #340 | Tragic 3.6% |
| Immigrants | Central America | 0.0 /100 | #341 | Tragic 3.6% |
| Immigrants | Mexico | 0.0 /100 | #342 | Tragic 3.6% |
| Salvadorans | 0.0 /100 | #343 | Tragic 3.7% |