Malaysian vs Senegalese GED/Equivalency
COMPARE
Malaysian
Senegalese
GED/Equivalency
GED/Equivalency Comparison
Malaysians
Senegalese
83.3%
GED/EQUIVALENCY
0.4/ 100
METRIC RATING
258th/ 347
METRIC RANK
84.0%
GED/EQUIVALENCY
1.9/ 100
METRIC RATING
241st/ 347
METRIC RANK
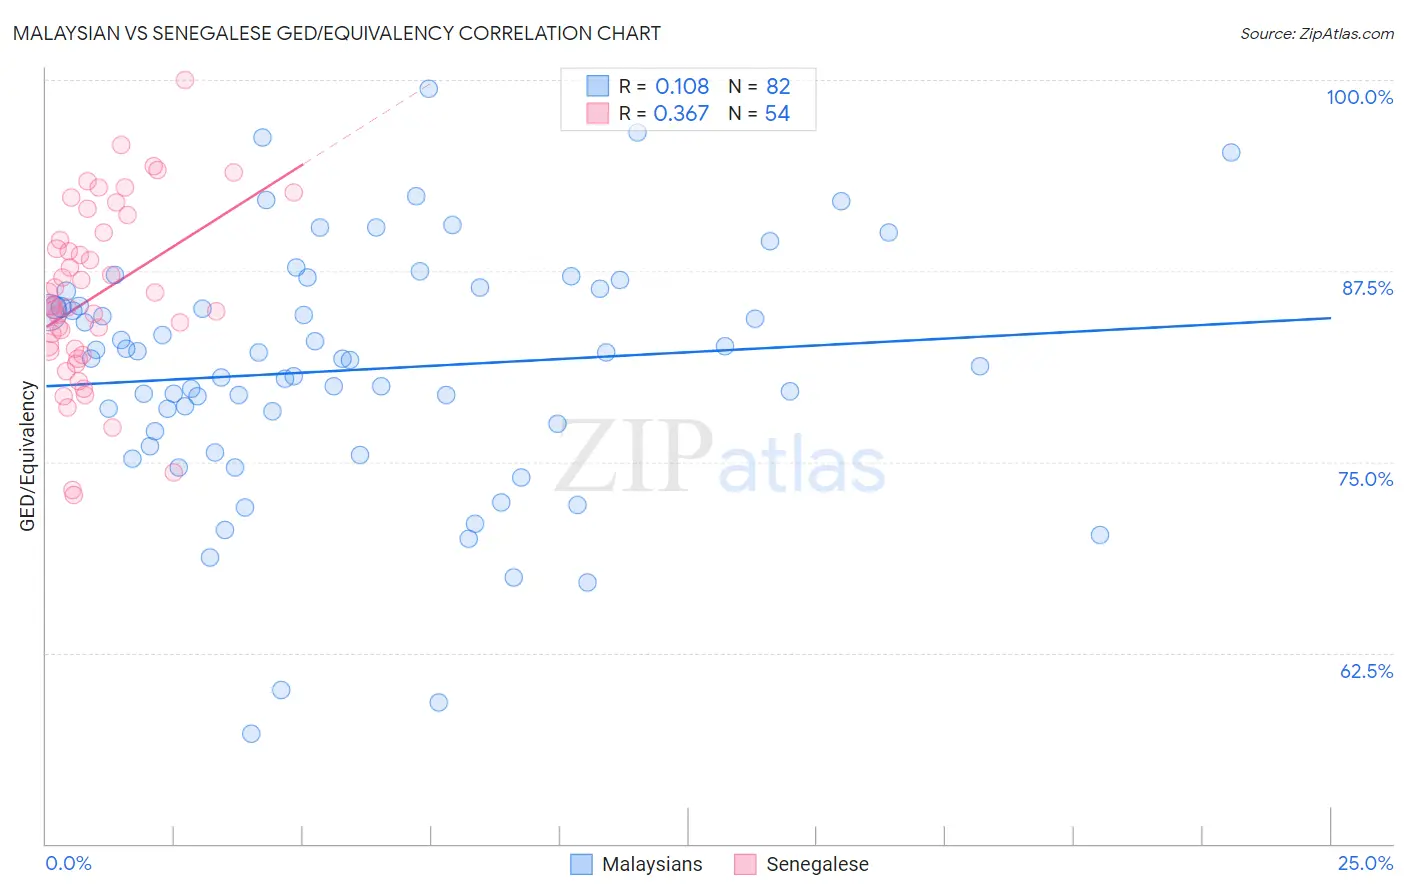
Malaysian vs Senegalese GED/Equivalency Correlation Chart
The statistical analysis conducted on geographies consisting of 226,108,706 people shows a poor positive correlation between the proportion of Malaysians and percentage of population with at least ged/equivalency education in the United States with a correlation coefficient (R) of 0.108 and weighted average of 83.3%. Similarly, the statistical analysis conducted on geographies consisting of 78,142,569 people shows a mild positive correlation between the proportion of Senegalese and percentage of population with at least ged/equivalency education in the United States with a correlation coefficient (R) of 0.367 and weighted average of 84.0%, a difference of 0.90%.
GED/Equivalency Correlation Summary
| Measurement | Malaysian | Senegalese |
| Minimum | 57.2% | 72.9% |
| Maximum | 99.4% | 100.0% |
| Range | 42.2% | 27.1% |
| Mean | 81.0% | 85.9% |
| Median | 81.7% | 85.2% |
| Interquartile 25% (IQ1) | 77.0% | 82.3% |
| Interquartile 75% (IQ3) | 86.1% | 90.0% |
| Interquartile Range (IQR) | 9.2% | 7.8% |
| Standard Deviation (Sample) | 8.1% | 5.8% |
| Standard Deviation (Population) | 8.0% | 5.8% |
Demographics Similar to Malaysians and Senegalese by GED/Equivalency
In terms of ged/equivalency, the demographic groups most similar to Malaysians are Jamaican (83.3%, a difference of 0.030%), Immigrants from Vietnam (83.2%, a difference of 0.14%), African (83.4%, a difference of 0.16%), Colville (83.4%, a difference of 0.17%), and Creek (83.6%, a difference of 0.33%). Similarly, the demographic groups most similar to Senegalese are Sri Lankan (84.0%, a difference of 0.020%), Immigrants from South Eastern Asia (84.1%, a difference of 0.14%), Immigrants from Bahamas (84.2%, a difference of 0.15%), Cherokee (83.9%, a difference of 0.19%), and Immigrants from Ghana (83.9%, a difference of 0.20%).
| Demographics | Rating | Rank | GED/Equivalency |
| Immigrants | Bahamas | 2.6 /100 | #239 | Tragic 84.2% |
| Immigrants | South Eastern Asia | 2.5 /100 | #240 | Tragic 84.1% |
| Senegalese | 1.9 /100 | #241 | Tragic 84.0% |
| Sri Lankans | 1.9 /100 | #242 | Tragic 84.0% |
| Cherokee | 1.3 /100 | #243 | Tragic 83.9% |
| Immigrants | Ghana | 1.3 /100 | #244 | Tragic 83.9% |
| Immigrants | Senegal | 1.2 /100 | #245 | Tragic 83.8% |
| Chickasaw | 1.2 /100 | #246 | Tragic 83.8% |
| Immigrants | Western Africa | 1.1 /100 | #247 | Tragic 83.8% |
| Blackfeet | 1.1 /100 | #248 | Tragic 83.8% |
| Crow | 1.1 /100 | #249 | Tragic 83.8% |
| Shoshone | 1.0 /100 | #250 | Tragic 83.7% |
| Spanish Americans | 0.8 /100 | #251 | Tragic 83.6% |
| Bahamians | 0.8 /100 | #252 | Tragic 83.6% |
| Comanche | 0.7 /100 | #253 | Tragic 83.6% |
| Creek | 0.7 /100 | #254 | Tragic 83.6% |
| Colville | 0.5 /100 | #255 | Tragic 83.4% |
| Africans | 0.5 /100 | #256 | Tragic 83.4% |
| Jamaicans | 0.4 /100 | #257 | Tragic 83.3% |
| Malaysians | 0.4 /100 | #258 | Tragic 83.3% |
| Immigrants | Vietnam | 0.3 /100 | #259 | Tragic 83.2% |