Immigrants from Hong Kong vs Senegalese GED/Equivalency
COMPARE
Immigrants from Hong Kong
Senegalese
GED/Equivalency
GED/Equivalency Comparison
Immigrants from Hong Kong
Senegalese
86.9%
GED/EQUIVALENCY
93.8/ 100
METRIC RATING
117th/ 347
METRIC RANK
84.0%
GED/EQUIVALENCY
1.9/ 100
METRIC RATING
241st/ 347
METRIC RANK
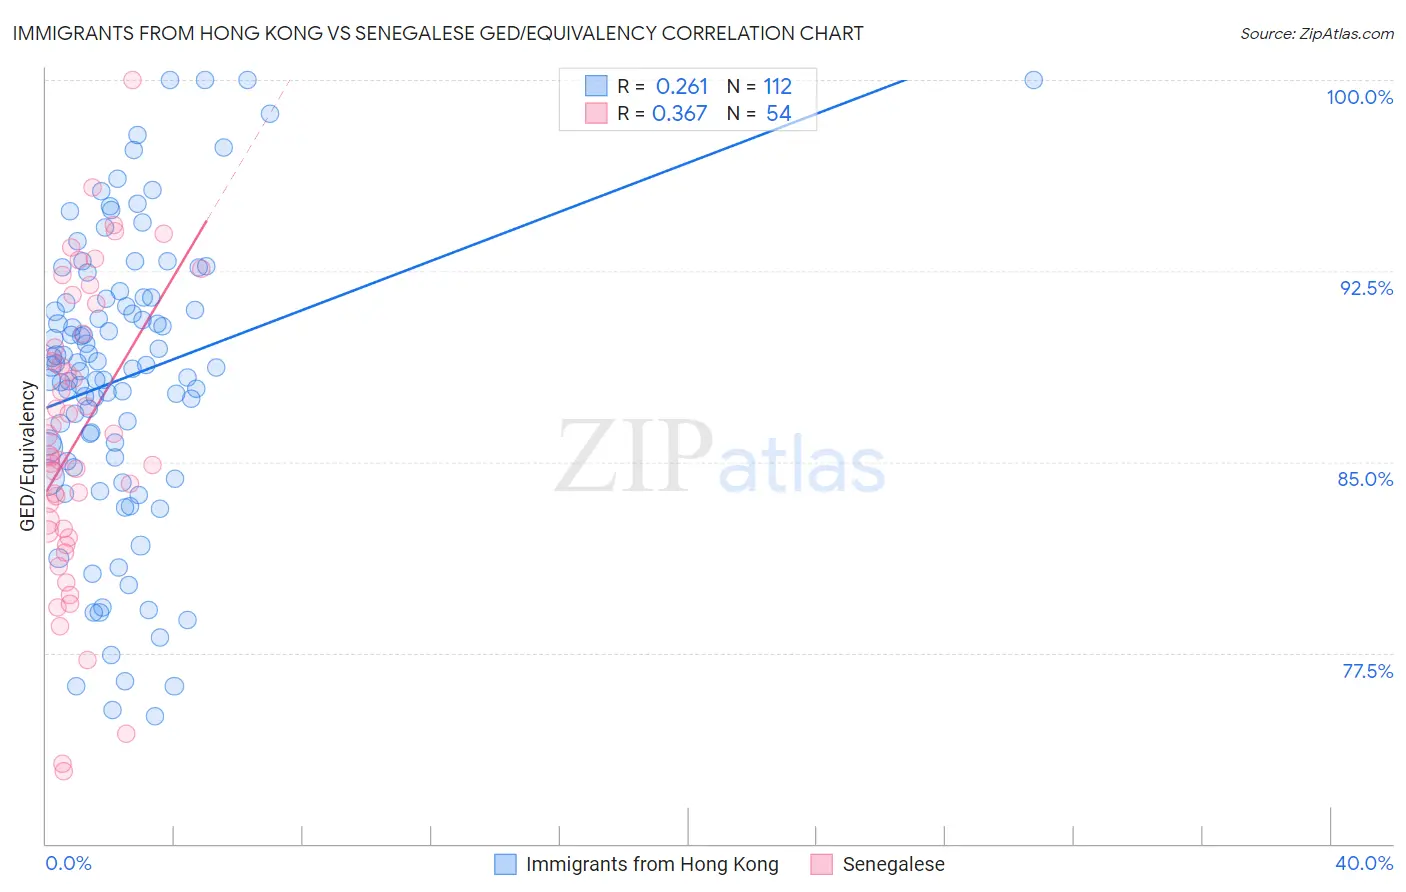
Immigrants from Hong Kong vs Senegalese GED/Equivalency Correlation Chart
The statistical analysis conducted on geographies consisting of 253,990,250 people shows a weak positive correlation between the proportion of Immigrants from Hong Kong and percentage of population with at least ged/equivalency education in the United States with a correlation coefficient (R) of 0.261 and weighted average of 86.9%. Similarly, the statistical analysis conducted on geographies consisting of 78,142,569 people shows a mild positive correlation between the proportion of Senegalese and percentage of population with at least ged/equivalency education in the United States with a correlation coefficient (R) of 0.367 and weighted average of 84.0%, a difference of 3.5%.
GED/Equivalency Correlation Summary
| Measurement | Immigrants from Hong Kong | Senegalese |
| Minimum | 75.0% | 72.9% |
| Maximum | 100.0% | 100.0% |
| Range | 25.0% | 27.1% |
| Mean | 88.3% | 85.9% |
| Median | 88.7% | 85.2% |
| Interquartile 25% (IQ1) | 85.1% | 82.3% |
| Interquartile 75% (IQ3) | 91.4% | 90.0% |
| Interquartile Range (IQR) | 6.3% | 7.8% |
| Standard Deviation (Sample) | 5.7% | 5.8% |
| Standard Deviation (Population) | 5.7% | 5.8% |
Similar Demographics by GED/Equivalency
Demographics Similar to Immigrants from Hong Kong by GED/Equivalency
In terms of ged/equivalency, the demographic groups most similar to Immigrants from Hong Kong are French Canadian (86.9%, a difference of 0.050%), Immigrants from China (86.9%, a difference of 0.050%), Swiss (87.0%, a difference of 0.070%), Mongolian (87.0%, a difference of 0.080%), and Immigrants from Kazakhstan (87.0%, a difference of 0.090%).
| Demographics | Rating | Rank | GED/Equivalency |
| Egyptians | 95.3 /100 | #110 | Exceptional 87.1% |
| French | 95.2 /100 | #111 | Exceptional 87.1% |
| Tlingit-Haida | 94.8 /100 | #112 | Exceptional 87.0% |
| Assyrians/Chaldeans/Syriacs | 94.8 /100 | #113 | Exceptional 87.0% |
| Immigrants | Kazakhstan | 94.7 /100 | #114 | Exceptional 87.0% |
| Mongolians | 94.6 /100 | #115 | Exceptional 87.0% |
| Swiss | 94.5 /100 | #116 | Exceptional 87.0% |
| Immigrants | Hong Kong | 93.8 /100 | #117 | Exceptional 86.9% |
| French Canadians | 93.2 /100 | #118 | Exceptional 86.9% |
| Immigrants | China | 93.2 /100 | #119 | Exceptional 86.9% |
| Scotch-Irish | 91.6 /100 | #120 | Exceptional 86.8% |
| Immigrants | Lebanon | 90.9 /100 | #121 | Exceptional 86.8% |
| Immigrants | Jordan | 90.8 /100 | #122 | Exceptional 86.8% |
| Immigrants | Italy | 90.5 /100 | #123 | Exceptional 86.7% |
| Immigrants | Egypt | 90.4 /100 | #124 | Exceptional 86.7% |
Demographics Similar to Senegalese by GED/Equivalency
In terms of ged/equivalency, the demographic groups most similar to Senegalese are Sri Lankan (84.0%, a difference of 0.020%), Immigrants from South Eastern Asia (84.1%, a difference of 0.14%), Immigrants from Bahamas (84.2%, a difference of 0.15%), Immigrants from Peru (84.2%, a difference of 0.18%), and Cherokee (83.9%, a difference of 0.19%).
| Demographics | Rating | Rank | GED/Equivalency |
| Immigrants | Nigeria | 3.6 /100 | #234 | Tragic 84.3% |
| Ghanaians | 3.5 /100 | #235 | Tragic 84.3% |
| Immigrants | Eritrea | 3.5 /100 | #236 | Tragic 84.3% |
| Sub-Saharan Africans | 3.0 /100 | #237 | Tragic 84.2% |
| Immigrants | Peru | 2.7 /100 | #238 | Tragic 84.2% |
| Immigrants | Bahamas | 2.6 /100 | #239 | Tragic 84.2% |
| Immigrants | South Eastern Asia | 2.5 /100 | #240 | Tragic 84.1% |
| Senegalese | 1.9 /100 | #241 | Tragic 84.0% |
| Sri Lankans | 1.9 /100 | #242 | Tragic 84.0% |
| Cherokee | 1.3 /100 | #243 | Tragic 83.9% |
| Immigrants | Ghana | 1.3 /100 | #244 | Tragic 83.9% |
| Immigrants | Senegal | 1.2 /100 | #245 | Tragic 83.8% |
| Chickasaw | 1.2 /100 | #246 | Tragic 83.8% |
| Immigrants | Western Africa | 1.1 /100 | #247 | Tragic 83.8% |
| Blackfeet | 1.1 /100 | #248 | Tragic 83.8% |