Syrian vs Ugandan Householder Income Ages 25 - 44 years
COMPARE
Syrian
Ugandan
Householder Income Ages 25 - 44 years
Householder Income Ages 25 - 44 years Comparison
Syrians
Ugandans
$99,215
HOUSEHOLDER INCOME AGES 25 - 44 YEARS
92.9/ 100
METRIC RATING
118th/ 347
METRIC RANK
$96,667
HOUSEHOLDER INCOME AGES 25 - 44 YEARS
76.2/ 100
METRIC RATING
150th/ 347
METRIC RANK
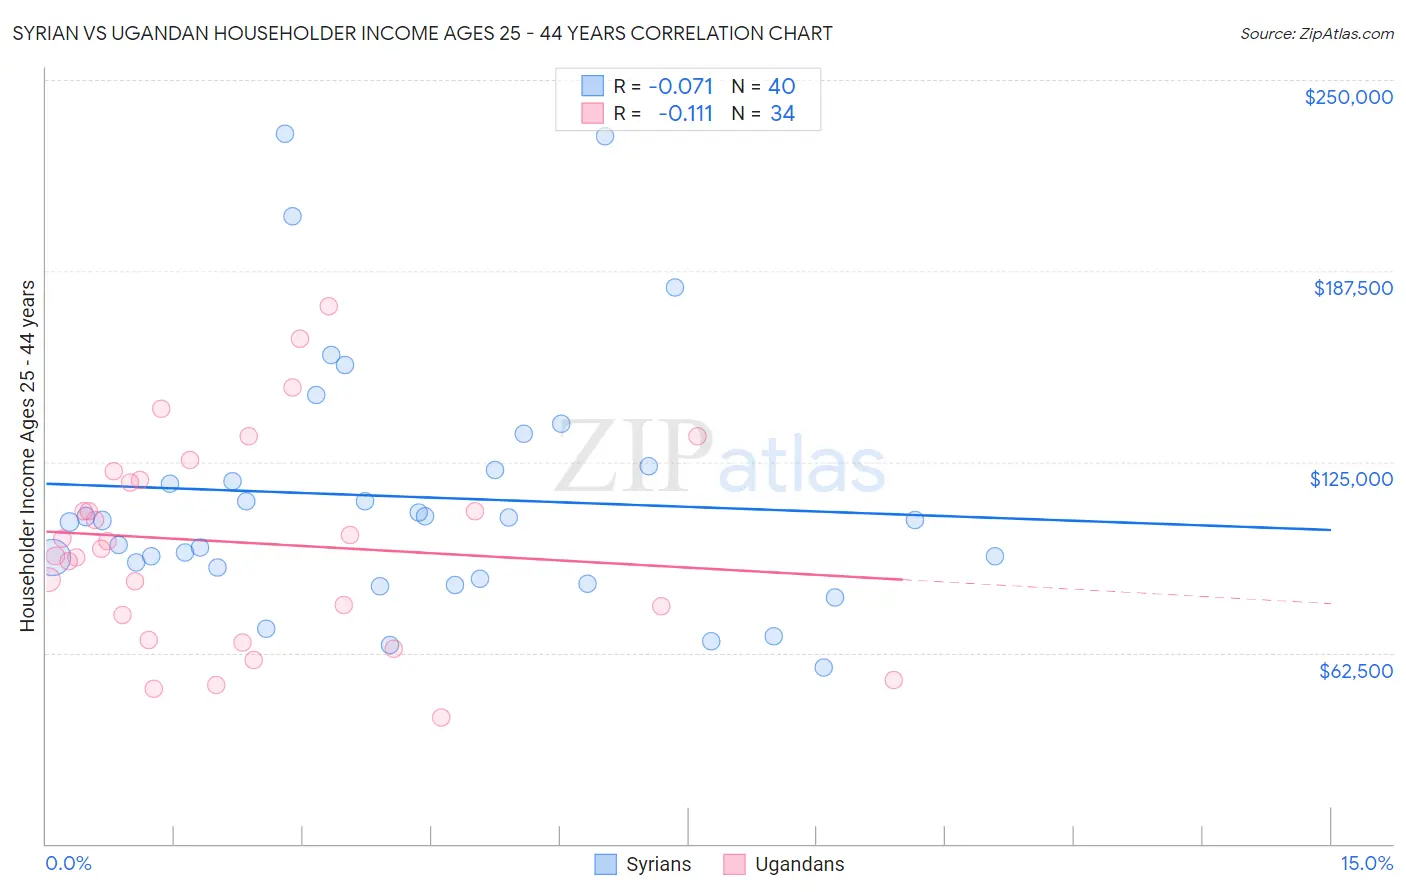
Syrian vs Ugandan Householder Income Ages 25 - 44 years Correlation Chart
The statistical analysis conducted on geographies consisting of 265,710,872 people shows a slight negative correlation between the proportion of Syrians and household income with householder between the ages 25 and 44 in the United States with a correlation coefficient (R) of -0.071 and weighted average of $99,215. Similarly, the statistical analysis conducted on geographies consisting of 93,976,499 people shows a poor negative correlation between the proportion of Ugandans and household income with householder between the ages 25 and 44 in the United States with a correlation coefficient (R) of -0.111 and weighted average of $96,667, a difference of 2.6%.
Householder Income Ages 25 - 44 years Correlation Summary
| Measurement | Syrian | Ugandan |
| Minimum | $57,774 | $41,159 |
| Maximum | $232,386 | $175,893 |
| Range | $174,612 | $134,734 |
| Mean | $113,575 | $98,580 |
| Median | $105,902 | $97,758 |
| Interquartile 25% (IQ1) | $88,495 | $74,874 |
| Interquartile 75% (IQ3) | $122,954 | $118,938 |
| Interquartile Range (IQR) | $34,460 | $44,063 |
| Standard Deviation (Sample) | $41,385 | $33,089 |
| Standard Deviation (Population) | $40,865 | $32,599 |
Similar Demographics by Householder Income Ages 25 - 44 years
Demographics Similar to Syrians by Householder Income Ages 25 - 44 years
In terms of householder income ages 25 - 44 years, the demographic groups most similar to Syrians are Immigrants from Northern Africa ($99,232, a difference of 0.020%), Jordanian ($99,186, a difference of 0.030%), Swedish ($99,136, a difference of 0.080%), Portuguese ($99,429, a difference of 0.22%), and Carpatho Rusyn ($99,449, a difference of 0.24%).
| Demographics | Rating | Rank | Householder Income Ages 25 - 44 years |
| Chileans | 95.1 /100 | #111 | Exceptional $99,900 |
| Poles | 94.5 /100 | #112 | Exceptional $99,685 |
| Tongans | 94.2 /100 | #113 | Exceptional $99,604 |
| Immigrants | Western Asia | 94.0 /100 | #114 | Exceptional $99,516 |
| Carpatho Rusyns | 93.7 /100 | #115 | Exceptional $99,449 |
| Portuguese | 93.7 /100 | #116 | Exceptional $99,429 |
| Immigrants | Northern Africa | 93.0 /100 | #117 | Exceptional $99,232 |
| Syrians | 92.9 /100 | #118 | Exceptional $99,215 |
| Jordanians | 92.8 /100 | #119 | Exceptional $99,186 |
| Swedes | 92.7 /100 | #120 | Exceptional $99,136 |
| Peruvians | 91.7 /100 | #121 | Exceptional $98,886 |
| Immigrants | Uzbekistan | 91.5 /100 | #122 | Exceptional $98,849 |
| Palestinians | 91.2 /100 | #123 | Exceptional $98,777 |
| Zimbabweans | 90.3 /100 | #124 | Exceptional $98,586 |
| Pakistanis | 89.3 /100 | #125 | Excellent $98,401 |
Demographics Similar to Ugandans by Householder Income Ages 25 - 44 years
In terms of householder income ages 25 - 44 years, the demographic groups most similar to Ugandans are Basque ($96,709, a difference of 0.040%), Irish ($96,730, a difference of 0.070%), Immigrants from Syria ($96,789, a difference of 0.13%), Czech ($96,525, a difference of 0.15%), and Ethiopian ($96,824, a difference of 0.16%).
| Demographics | Rating | Rank | Householder Income Ages 25 - 44 years |
| Immigrants | Jordan | 81.0 /100 | #143 | Excellent $97,185 |
| Immigrants | Chile | 80.8 /100 | #144 | Excellent $97,159 |
| Norwegians | 78.2 /100 | #145 | Good $96,866 |
| Ethiopians | 77.8 /100 | #146 | Good $96,824 |
| Immigrants | Syria | 77.4 /100 | #147 | Good $96,789 |
| Irish | 76.9 /100 | #148 | Good $96,730 |
| Basques | 76.6 /100 | #149 | Good $96,709 |
| Ugandans | 76.2 /100 | #150 | Good $96,667 |
| Czechs | 74.8 /100 | #151 | Good $96,525 |
| South American Indians | 74.5 /100 | #152 | Good $96,497 |
| Slovenes | 73.9 /100 | #153 | Good $96,439 |
| Slavs | 73.2 /100 | #154 | Good $96,377 |
| Moroccans | 70.3 /100 | #155 | Good $96,117 |
| Immigrants | Germany | 67.9 /100 | #156 | Good $95,913 |
| Immigrants | Uganda | 65.2 /100 | #157 | Good $95,698 |