Syrian vs Ugandan Child Poverty Under the Age of 5

COMPARE

Syrian
Race
Ancestry
AfghanAfricanAlaska NativeAlaskan AthabascanAlbanianAleutAlsatianAmericanApacheArabArapahoArgentineanArmenianAssyrian/Chaldean/SyriacAustralianAustrianBahamianBangladeshiBarbadianBasqueBelgianBelizeanBermudanBhutaneseBlackfeetBolivianBrazilianBritishBritish West IndianBulgarianBurmeseCajunCambodianCanadianCape VerdeanCarpatho RusynCelticCentral AmericanCentral American IndianCherokeeCheyenneChickasawChileanChineseChippewaChoctawColombianColvilleComancheCosta RicanCreeCreekCroatianCrowCubanCypriotCzechCzechoslovakianDanishDelawareDominicanDutchDutch West IndianEastern EuropeanEcuadorianEgyptianEnglishEstonianEthiopianEuropeanFijianFilipinoFinnishFrenchFrench American IndianFrench CanadianGermanGerman RussianGhanaianGreekGuamanian/ChamorroGuatemalanGuyaneseHaitianHmongHonduranHopiHoumaHungarianIcelanderIndian (Asian)IndonesianInupiatIranianIraqiIrishIroquoisIsraeliItalianJamaicanJapaneseJordanianKenyanKiowaKoreanLaotianLatvianLebaneseLiberianLithuanianLumbeeLuxembourgerMacedonianMalaysianMalteseMarshalleseMenomineeMexicanMexican American IndianMongolianMoroccanNative HawaiianNavajoNepaleseNew ZealanderNicaraguanNigerianNorthern EuropeanNorwegianOkinawanOsageOttawaPaiutePakistaniPalestinianPanamanianParaguayanPennsylvania GermanPeruvianPimaPolishPortuguesePotawatomiPuebloPuerto RicanPuget Sound SalishRomanianRussianSalvadoranSamoanScandinavianScotch-IrishScottishSeminoleSenegaleseSerbianShoshoneSierra LeoneanSiouxSlavicSlovakSloveneSomaliSouth AfricanSouth AmericanSouth American IndianSoviet UnionSpaniardSpanishSpanish AmericanSpanish American IndianSri LankanSubsaharan AfricanSudaneseSwedishSwissSyrianTaiwaneseThaiTlingit-HaidaTohono O'OdhamTonganTrinidadian and TobagonianTsimshianTurkishU.S. Virgin IslanderUkrainianUruguayanUteVenezuelanVietnameseWelshWest IndianYakamaYaquiYugoslavianYumanYup'ikZimbabwean
Immigration
NonimmigrantsImmigrantsAfghanistanAfricaAlbaniaArgentinaArmeniaAsiaAustraliaAustriaBahamasBangladeshBarbadosBelarusBelgiumBelizeBoliviaBosnia and HerzegovinaBrazilBulgariaBurma/MyanmarCabo VerdeCambodiaCameroonCanadaCaribbeanCentral AmericaChileChinaColombiaCongoCosta RicaCroatiaCubaCzechoslovakiaDenmarkDominicaDominican RepublicEastern AfricaEastern AsiaEastern EuropeEcuadorEgyptEl SalvadorEnglandEritreaEthiopiaEuropeFijiFranceGermanyGhanaGreeceGrenadaGuatemalaGuyanaHaitiHondurasHong KongHungaryIndiaIndonesiaIranIraqIrelandIsraelItalyJamaicaJapanJordanKazakhstanKenyaKoreaKuwaitLaosLatin AmericaLatviaLebanonLiberiaLithuaniaMalaysiaMexicoMicronesiaMiddle AfricaMoldovaMoroccoNepalNetherlandsNicaraguaNigeriaNorth AmericaNorth MacedoniaNorthern AfricaNorthern EuropeNorwayOceaniaPakistanPanamaPeruPhilippinesPolandPortugalRomaniaRussiaSaudi ArabiaScotlandSenegalSerbiaSierra LeoneSingaporeSomaliaSouth AfricaSouth AmericaSouth Central AsiaSouth Eastern AsiaSouthern EuropeSpainSri LankaSt. Vincent and the GrenadinesSudanSwedenSwitzerlandSyriaTaiwanThailandTrinidad and TobagoTurkeyUgandaUkraineUruguayUzbekistanVenezuelaVietnamWest IndiesWestern AfricaWestern AsiaWestern EuropeYemenZaireZimbabweAzores
Ugandan
Race
Ancestry
AfghanAfricanAlaska NativeAlaskan AthabascanAlbanianAleutAlsatianAmericanApacheArabArapahoArgentineanArmenianAssyrian/Chaldean/SyriacAustralianAustrianBahamianBangladeshiBarbadianBasqueBelgianBelizeanBermudanBhutaneseBlackfeetBolivianBrazilianBritishBritish West IndianBulgarianBurmeseCajunCambodianCanadianCape VerdeanCarpatho RusynCelticCentral AmericanCentral American IndianCherokeeCheyenneChickasawChileanChineseChippewaChoctawColombianColvilleComancheCosta RicanCreeCreekCroatianCrowCubanCypriotCzechCzechoslovakianDanishDelawareDominicanDutchDutch West IndianEastern EuropeanEcuadorianEgyptianEnglishEstonianEthiopianEuropeanFijianFilipinoFinnishFrenchFrench American IndianFrench CanadianGermanGerman RussianGhanaianGreekGuamanian/ChamorroGuatemalanGuyaneseHaitianHmongHonduranHopiHoumaHungarianIcelanderIndian (Asian)IndonesianInupiatIranianIraqiIrishIroquoisIsraeliItalianJamaicanJapaneseJordanianKenyanKiowaKoreanLaotianLatvianLebaneseLiberianLithuanianLumbeeLuxembourgerMacedonianMalaysianMalteseMarshalleseMenomineeMexicanMexican American IndianMongolianMoroccanNative HawaiianNavajoNepaleseNew ZealanderNicaraguanNigerianNorthern EuropeanNorwegianOkinawanOsageOttawaPaiutePakistaniPalestinianPanamanianParaguayanPennsylvania GermanPeruvianPimaPolishPortuguesePotawatomiPuebloPuerto RicanPuget Sound SalishRomanianRussianSalvadoranSamoanScandinavianScotch-IrishScottishSeminoleSenegaleseSerbianShoshoneSierra LeoneanSiouxSlavicSlovakSloveneSomaliSouth AfricanSouth AmericanSouth American IndianSoviet UnionSpaniardSpanishSpanish AmericanSpanish American IndianSri LankanSubsaharan AfricanSudaneseSwedishSwissTaiwaneseThaiTlingit-HaidaTohono O'OdhamTonganTrinidadian and TobagonianTsimshianTurkishU.S. Virgin IslanderUgandanUkrainianUruguayanUteVenezuelanVietnameseWelshWest IndianYakamaYaquiYugoslavianYumanYup'ikZimbabwean
Immigration
NonimmigrantsImmigrantsAfghanistanAfricaAlbaniaArgentinaArmeniaAsiaAustraliaAustriaBahamasBangladeshBarbadosBelarusBelgiumBelizeBoliviaBosnia and HerzegovinaBrazilBulgariaBurma/MyanmarCabo VerdeCambodiaCameroonCanadaCaribbeanCentral AmericaChileChinaColombiaCongoCosta RicaCroatiaCubaCzechoslovakiaDenmarkDominicaDominican RepublicEastern AfricaEastern AsiaEastern EuropeEcuadorEgyptEl SalvadorEnglandEritreaEthiopiaEuropeFijiFranceGermanyGhanaGreeceGrenadaGuatemalaGuyanaHaitiHondurasHong KongHungaryIndiaIndonesiaIranIraqIrelandIsraelItalyJamaicaJapanJordanKazakhstanKenyaKoreaKuwaitLaosLatin AmericaLatviaLebanonLiberiaLithuaniaMalaysiaMexicoMicronesiaMiddle AfricaMoldovaMoroccoNepalNetherlandsNicaraguaNigeriaNorth AmericaNorth MacedoniaNorthern AfricaNorthern EuropeNorwayOceaniaPakistanPanamaPeruPhilippinesPolandPortugalRomaniaRussiaSaudi ArabiaScotlandSenegalSerbiaSierra LeoneSingaporeSomaliaSouth AfricaSouth AmericaSouth Central AsiaSouth Eastern AsiaSouthern EuropeSpainSri LankaSt. Vincent and the GrenadinesSudanSwedenSwitzerlandSyriaTaiwanThailandTrinidad and TobagoTurkeyUgandaUkraineUruguayUzbekistanVenezuelaVietnamWest IndiesWestern AfricaWestern AsiaWestern EuropeYemenZaireZimbabweAzores
Child Poverty Under the Age of 5
Income
Poverty
Unemployment
Labor Participation
Family Structure
Vehicle Availability
Education Level
Disability

Child Poverty Under the Age of 5 Comparison

Syrians

Ugandans

Good
Poor
16.6%
CHILD POVERTY UNDER THE AGE OF 5
79.1/ 100
METRIC RATING
148th/ 347
METRIC RANK
18.0%
CHILD POVERTY UNDER THE AGE OF 5
13.9/ 100
METRIC RATING
201st/ 347
METRIC RANK

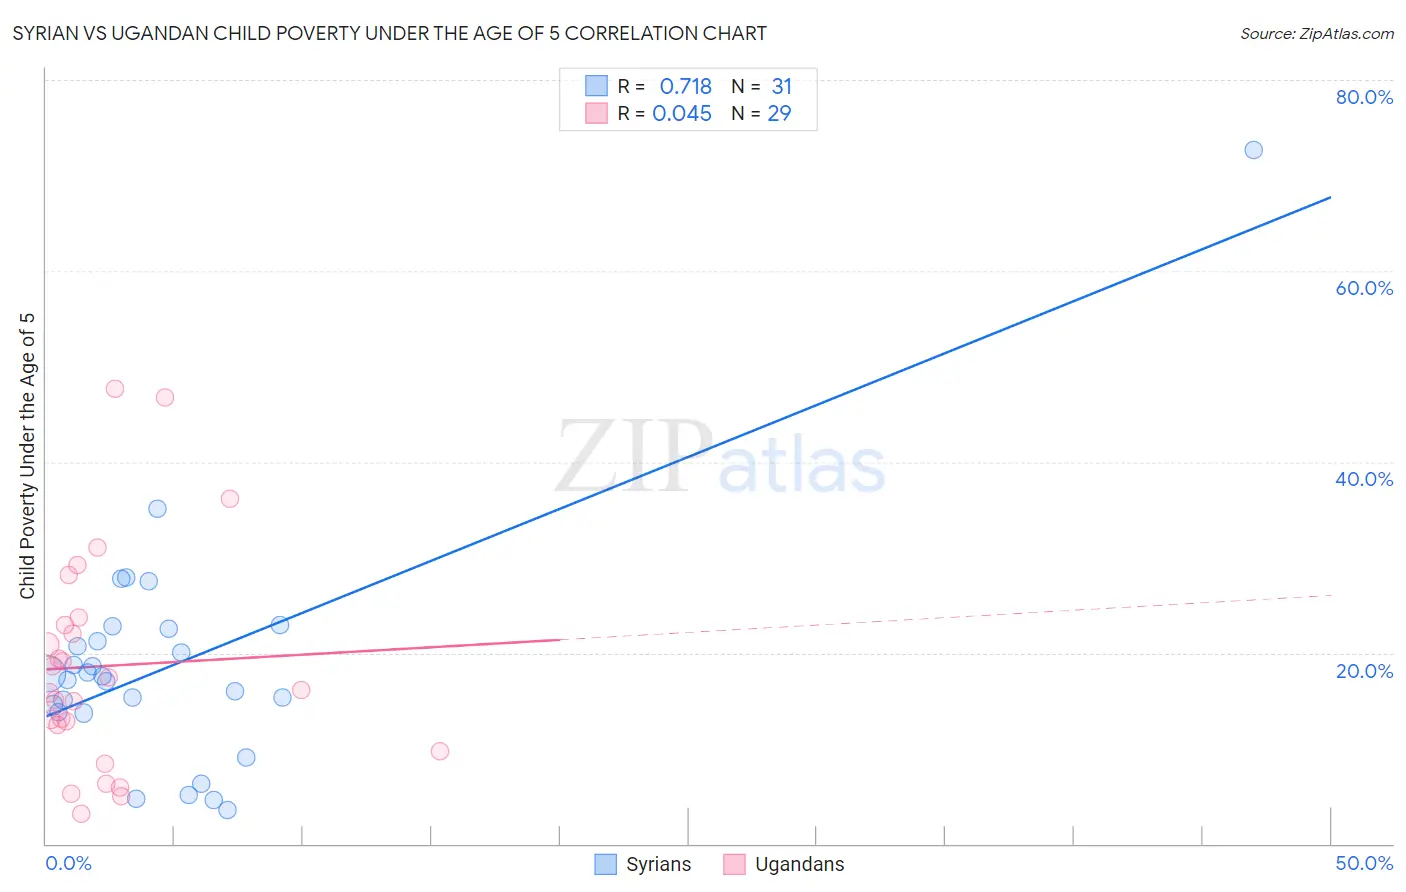
Syrian vs Ugandan Child Poverty Under the Age of 5 Correlation Chart

The statistical analysis conducted on geographies consisting of 256,842,692 people shows a strong positive correlation between the proportion of Syrians and poverty level among children under the age of 5 in the United States with a correlation coefficient (R) of 0.718 and weighted average of 16.6%. Similarly, the statistical analysis conducted on geographies consisting of 92,908,510 people shows no correlation between the proportion of Ugandans and poverty level among children under the age of 5 in the United States with a correlation coefficient (R) of 0.045 and weighted average of 18.0%, a difference of 8.5%.
Syrian vs Ugandan Child Poverty Under the Age of 5

Child Poverty Under the Age of 5 Correlation Summary

MeasurementSyrianUgandan
Minimum3.5%3.2%
Maximum72.7%47.7%
Range69.2%44.5%
Mean18.8%18.6%
Median17.5%16.0%
Interquartile 25% (IQ1)13.8%11.1%
Interquartile 75% (IQ3)22.5%23.3%
Interquartile Range (IQR)8.7%12.2%
Standard Deviation (Sample)12.5%11.4%
Standard Deviation (Population)12.3%11.2%

Similar Demographics by Child Poverty Under the Age of 5

Demographics Similar to Syrians by Child Poverty Under the Age of 5

In terms of child poverty under the age of 5, the demographic groups most similar to Syrians are New Zealander (16.6%, a difference of 0.060%), Immigrants from Nepal (16.6%, a difference of 0.19%), Colombian (16.7%, a difference of 0.20%), Canadian (16.7%, a difference of 0.23%), and Belgian (16.7%, a difference of 0.30%).
DemographicsRating | RankChild Poverty Under the Age of 5
Immigrants | Western Europe
83.3
/100
|
#141
Excellent
16.5%
Portuguese
83.0
/100
|
#142
Excellent
16.5%
Samoans
83.0
/100
|
#143
Excellent
16.5%
Ethiopians
82.7
/100
|
#144
Excellent
16.5%
Immigrants | Ethiopia
82.1
/100
|
#145
Excellent
16.6%
Israelis
82.0
/100
|
#146
Excellent
16.6%
Immigrants | Nepal
80.3
/100
|
#147
Excellent
16.6%
Syrians
79.1
/100
|
#148
Good
16.6%
New Zealanders
78.7
/100
|
#149
Good
16.6%
Colombians
77.8
/100
|
#150
Good
16.7%
Canadians
77.6
/100
|
#151
Good
16.7%
Belgians
77.2
/100
|
#152
Good
16.7%
Dutch
77.1
/100
|
#153
Good
16.7%
Immigrants | Venezuela
76.0
/100
|
#154
Good
16.7%
South Americans
75.1
/100
|
#155
Good
16.7%

Demographics Similar to Ugandans by Child Poverty Under the Age of 5

In terms of child poverty under the age of 5, the demographic groups most similar to Ugandans are Iraqi (18.0%, a difference of 0.010%), Japanese (18.1%, a difference of 0.020%), Immigrants from Cambodia (18.1%, a difference of 0.040%), Immigrants from Eastern Africa (18.1%, a difference of 0.090%), and Spaniard (18.1%, a difference of 0.22%).
DemographicsRating | RankChild Poverty Under the Age of 5
French Canadians
24.6
/100
|
#194
Fair
17.7%
Sierra Leoneans
24.1
/100
|
#195
Fair
17.7%
Immigrants | Portugal
22.2
/100
|
#196
Fair
17.8%
Immigrants | Kenya
20.0
/100
|
#197
Fair
17.9%
Celtics
18.3
/100
|
#198
Poor
17.9%
Hungarians
18.3
/100
|
#199
Poor
17.9%
Iraqis
14.0
/100
|
#200
Poor
18.0%
Ugandans
13.9
/100
|
#201
Poor
18.0%
Japanese
13.8
/100
|
#202
Poor
18.1%
Immigrants | Cambodia
13.7
/100
|
#203
Poor
18.1%
Immigrants | Eastern Africa
13.4
/100
|
#204
Poor
18.1%
Spaniards
12.8
/100
|
#205
Poor
18.1%
Whites/Caucasians
12.6
/100
|
#206
Poor
18.1%
Immigrants | Immigrants
9.9
/100
|
#207
Tragic
18.2%
Scotch-Irish
9.8
/100
|
#208
Tragic
18.2%