Syrian vs Senegalese No Schooling Completed
COMPARE
Syrian
Senegalese
No Schooling Completed
No Schooling Completed Comparison
Syrians
Senegalese
1.9%
NO SCHOOLING COMPLETED
96.0/ 100
METRIC RATING
115th/ 347
METRIC RANK
2.3%
NO SCHOOLING COMPLETED
5.6/ 100
METRIC RATING
219th/ 347
METRIC RANK
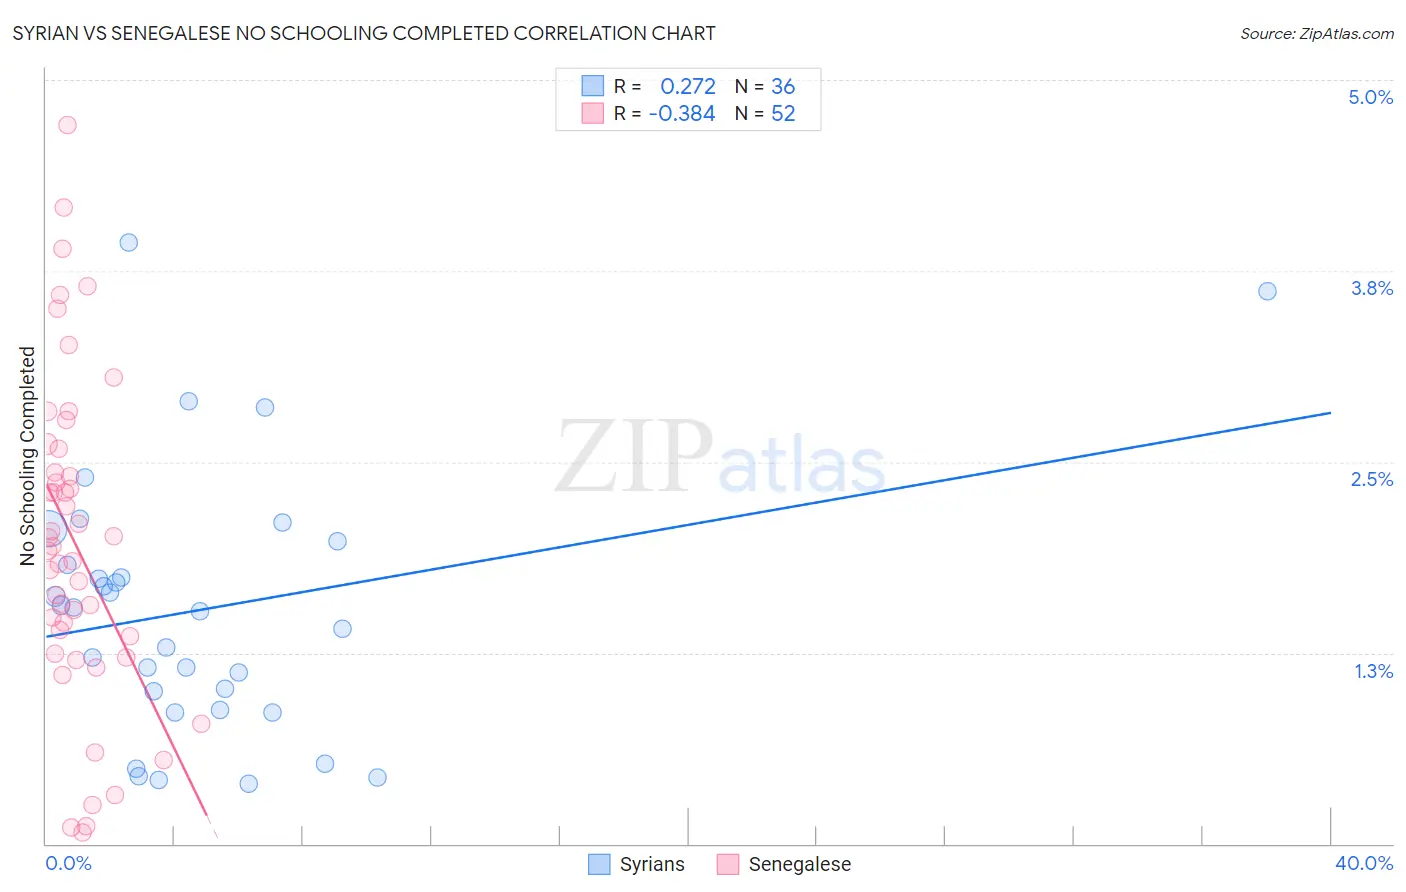
Syrian vs Senegalese No Schooling Completed Correlation Chart
The statistical analysis conducted on geographies consisting of 264,321,115 people shows a weak positive correlation between the proportion of Syrians and percentage of population with no schooling in the United States with a correlation coefficient (R) of 0.272 and weighted average of 1.9%. Similarly, the statistical analysis conducted on geographies consisting of 78,004,771 people shows a mild negative correlation between the proportion of Senegalese and percentage of population with no schooling in the United States with a correlation coefficient (R) of -0.384 and weighted average of 2.3%, a difference of 22.6%.
No Schooling Completed Correlation Summary
| Measurement | Syrian | Senegalese |
| Minimum | 0.39% | 0.075% |
| Maximum | 3.9% | 4.7% |
| Range | 3.5% | 4.6% |
| Mean | 1.5% | 2.0% |
| Median | 1.5% | 1.9% |
| Interquartile 25% (IQ1) | 0.93% | 1.3% |
| Interquartile 75% (IQ3) | 1.9% | 2.5% |
| Interquartile Range (IQR) | 0.97% | 1.2% |
| Standard Deviation (Sample) | 0.85% | 1.1% |
| Standard Deviation (Population) | 0.84% | 1.0% |
Similar Demographics by No Schooling Completed
Demographics Similar to Syrians by No Schooling Completed
In terms of no schooling completed, the demographic groups most similar to Syrians are Lebanese (1.9%, a difference of 0.020%), Immigrants from Norway (1.9%, a difference of 0.13%), Immigrants from Zimbabwe (1.9%, a difference of 0.14%), Immigrants from Serbia (1.9%, a difference of 0.22%), and Pueblo (1.9%, a difference of 0.38%).
| Demographics | Rating | Rank | No Schooling Completed |
| Okinawans | 97.1 /100 | #108 | Exceptional 1.8% |
| Immigrants | Saudi Arabia | 96.8 /100 | #109 | Exceptional 1.9% |
| Immigrants | Latvia | 96.7 /100 | #110 | Exceptional 1.9% |
| Immigrants | Japan | 96.6 /100 | #111 | Exceptional 1.9% |
| Pueblo | 96.4 /100 | #112 | Exceptional 1.9% |
| Immigrants | Zimbabwe | 96.2 /100 | #113 | Exceptional 1.9% |
| Immigrants | Norway | 96.1 /100 | #114 | Exceptional 1.9% |
| Syrians | 96.0 /100 | #115 | Exceptional 1.9% |
| Lebanese | 96.0 /100 | #116 | Exceptional 1.9% |
| Immigrants | Serbia | 95.8 /100 | #117 | Exceptional 1.9% |
| Spanish | 95.5 /100 | #118 | Exceptional 1.9% |
| Iroquois | 95.1 /100 | #119 | Exceptional 1.9% |
| Immigrants | Bulgaria | 94.6 /100 | #120 | Exceptional 1.9% |
| Immigrants | Croatia | 94.5 /100 | #121 | Exceptional 1.9% |
| Cree | 94.5 /100 | #122 | Exceptional 1.9% |
Demographics Similar to Senegalese by No Schooling Completed
In terms of no schooling completed, the demographic groups most similar to Senegalese are Immigrants from Costa Rica (2.3%, a difference of 0.26%), Immigrants from Sudan (2.3%, a difference of 0.35%), Immigrants from Nepal (2.3%, a difference of 0.44%), Subsaharan African (2.3%, a difference of 0.53%), and Immigrants from Syria (2.3%, a difference of 0.55%).
| Demographics | Rating | Rank | No Schooling Completed |
| Immigrants | Morocco | 8.7 /100 | #212 | Tragic 2.3% |
| Ute | 8.2 /100 | #213 | Tragic 2.3% |
| Samoans | 8.2 /100 | #214 | Tragic 2.3% |
| Immigrants | Zaire | 7.2 /100 | #215 | Tragic 2.3% |
| Tongans | 6.8 /100 | #216 | Tragic 2.3% |
| Immigrants | Syria | 6.6 /100 | #217 | Tragic 2.3% |
| Immigrants | Nepal | 6.4 /100 | #218 | Tragic 2.3% |
| Senegalese | 5.6 /100 | #219 | Tragic 2.3% |
| Immigrants | Costa Rica | 5.1 /100 | #220 | Tragic 2.3% |
| Immigrants | Sudan | 5.0 /100 | #221 | Tragic 2.3% |
| Sub-Saharan Africans | 4.7 /100 | #222 | Tragic 2.3% |
| Immigrants | Lebanon | 4.5 /100 | #223 | Tragic 2.3% |
| Tohono O'odham | 4.1 /100 | #224 | Tragic 2.3% |
| Sudanese | 4.1 /100 | #225 | Tragic 2.3% |
| Sierra Leoneans | 4.1 /100 | #226 | Tragic 2.3% |