Syrian vs Ghanaian No Schooling Completed
COMPARE
Syrian
Ghanaian
No Schooling Completed
No Schooling Completed Comparison
Syrians
Ghanaians
1.9%
NO SCHOOLING COMPLETED
96.0/ 100
METRIC RATING
115th/ 347
METRIC RANK
2.6%
NO SCHOOLING COMPLETED
0.1/ 100
METRIC RATING
274th/ 347
METRIC RANK
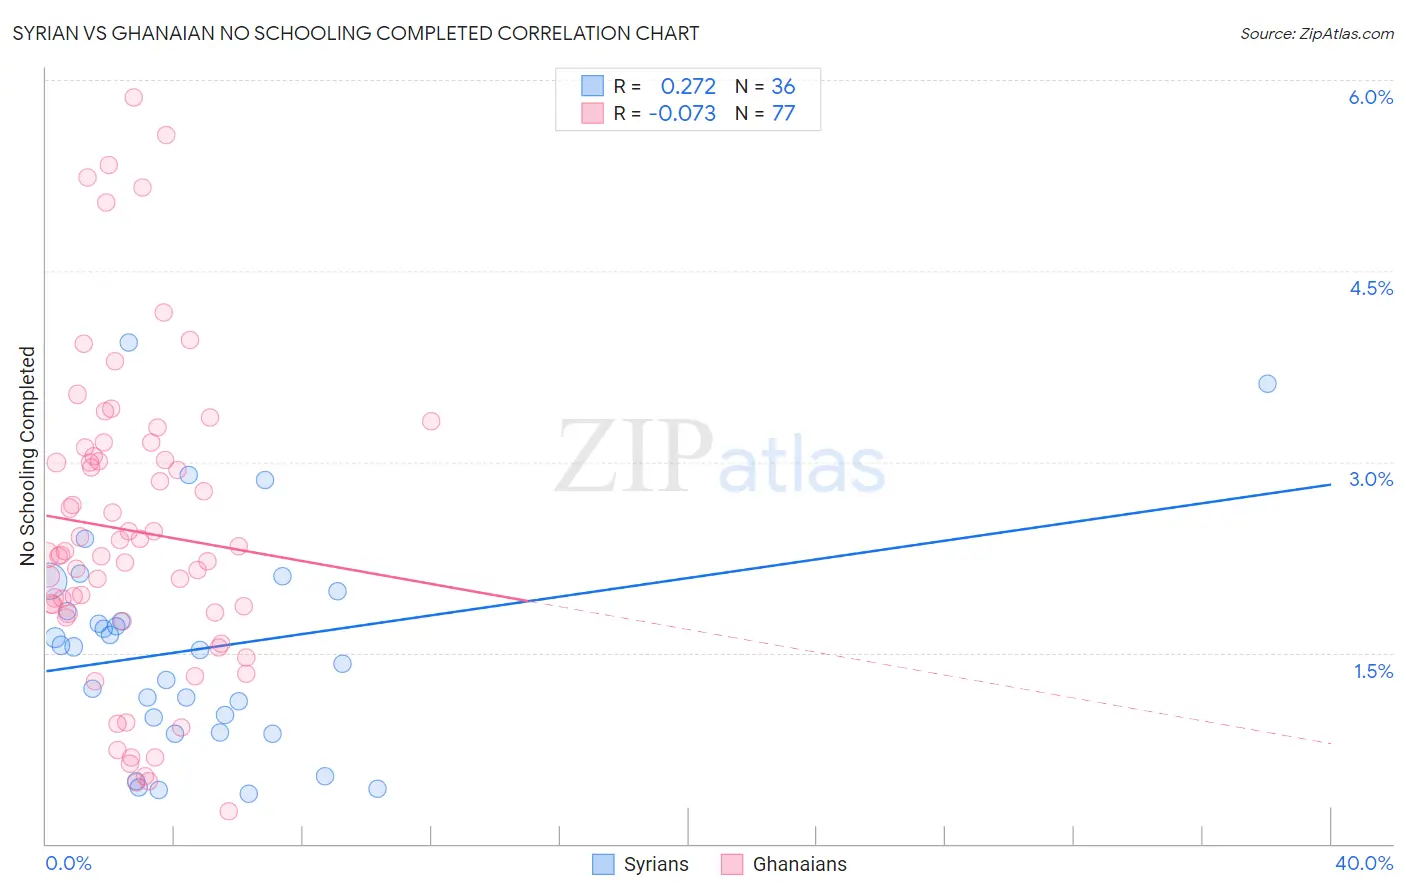
Syrian vs Ghanaian No Schooling Completed Correlation Chart
The statistical analysis conducted on geographies consisting of 264,321,115 people shows a weak positive correlation between the proportion of Syrians and percentage of population with no schooling in the United States with a correlation coefficient (R) of 0.272 and weighted average of 1.9%. Similarly, the statistical analysis conducted on geographies consisting of 189,718,385 people shows a slight negative correlation between the proportion of Ghanaians and percentage of population with no schooling in the United States with a correlation coefficient (R) of -0.073 and weighted average of 2.6%, a difference of 37.0%.
No Schooling Completed Correlation Summary
| Measurement | Syrian | Ghanaian |
| Minimum | 0.39% | 0.26% |
| Maximum | 3.9% | 5.9% |
| Range | 3.5% | 5.6% |
| Mean | 1.5% | 2.5% |
| Median | 1.5% | 2.3% |
| Interquartile 25% (IQ1) | 0.93% | 1.8% |
| Interquartile 75% (IQ3) | 1.9% | 3.1% |
| Interquartile Range (IQR) | 0.97% | 1.3% |
| Standard Deviation (Sample) | 0.85% | 1.2% |
| Standard Deviation (Population) | 0.84% | 1.2% |
Similar Demographics by No Schooling Completed
Demographics Similar to Syrians by No Schooling Completed
In terms of no schooling completed, the demographic groups most similar to Syrians are Lebanese (1.9%, a difference of 0.020%), Immigrants from Norway (1.9%, a difference of 0.13%), Immigrants from Zimbabwe (1.9%, a difference of 0.14%), Immigrants from Serbia (1.9%, a difference of 0.22%), and Pueblo (1.9%, a difference of 0.38%).
| Demographics | Rating | Rank | No Schooling Completed |
| Okinawans | 97.1 /100 | #108 | Exceptional 1.8% |
| Immigrants | Saudi Arabia | 96.8 /100 | #109 | Exceptional 1.9% |
| Immigrants | Latvia | 96.7 /100 | #110 | Exceptional 1.9% |
| Immigrants | Japan | 96.6 /100 | #111 | Exceptional 1.9% |
| Pueblo | 96.4 /100 | #112 | Exceptional 1.9% |
| Immigrants | Zimbabwe | 96.2 /100 | #113 | Exceptional 1.9% |
| Immigrants | Norway | 96.1 /100 | #114 | Exceptional 1.9% |
| Syrians | 96.0 /100 | #115 | Exceptional 1.9% |
| Lebanese | 96.0 /100 | #116 | Exceptional 1.9% |
| Immigrants | Serbia | 95.8 /100 | #117 | Exceptional 1.9% |
| Spanish | 95.5 /100 | #118 | Exceptional 1.9% |
| Iroquois | 95.1 /100 | #119 | Exceptional 1.9% |
| Immigrants | Bulgaria | 94.6 /100 | #120 | Exceptional 1.9% |
| Immigrants | Croatia | 94.5 /100 | #121 | Exceptional 1.9% |
| Cree | 94.5 /100 | #122 | Exceptional 1.9% |
Demographics Similar to Ghanaians by No Schooling Completed
In terms of no schooling completed, the demographic groups most similar to Ghanaians are Immigrants from China (2.6%, a difference of 0.18%), Immigrants from Cameroon (2.5%, a difference of 0.37%), Immigrants from Western Africa (2.6%, a difference of 0.74%), Immigrants from Philippines (2.6%, a difference of 0.80%), and Immigrants from Uzbekistan (2.6%, a difference of 1.0%).
| Demographics | Rating | Rank | No Schooling Completed |
| Yuman | 0.4 /100 | #267 | Tragic 2.5% |
| Taiwanese | 0.3 /100 | #268 | Tragic 2.5% |
| Immigrants | Nigeria | 0.2 /100 | #269 | Tragic 2.5% |
| Immigrants | Peru | 0.2 /100 | #270 | Tragic 2.5% |
| Cubans | 0.2 /100 | #271 | Tragic 2.5% |
| Immigrants | Bolivia | 0.2 /100 | #272 | Tragic 2.5% |
| Immigrants | Cameroon | 0.1 /100 | #273 | Tragic 2.5% |
| Ghanaians | 0.1 /100 | #274 | Tragic 2.6% |
| Immigrants | China | 0.1 /100 | #275 | Tragic 2.6% |
| Immigrants | Western Africa | 0.1 /100 | #276 | Tragic 2.6% |
| Immigrants | Philippines | 0.1 /100 | #277 | Tragic 2.6% |
| Immigrants | Uzbekistan | 0.1 /100 | #278 | Tragic 2.6% |
| Barbadians | 0.1 /100 | #279 | Tragic 2.6% |
| Trinidadians and Tobagonians | 0.1 /100 | #280 | Tragic 2.6% |
| Afghans | 0.1 /100 | #281 | Tragic 2.6% |