Bolivian vs Hmong 2nd Grade
COMPARE
Bolivian
Hmong
2nd Grade
2nd Grade Comparison
Bolivians
Hmong
97.5%
2ND GRADE
0.9/ 100
METRIC RATING
249th/ 347
METRIC RANK
98.0%
2ND GRADE
80.0/ 100
METRIC RATING
144th/ 347
METRIC RANK
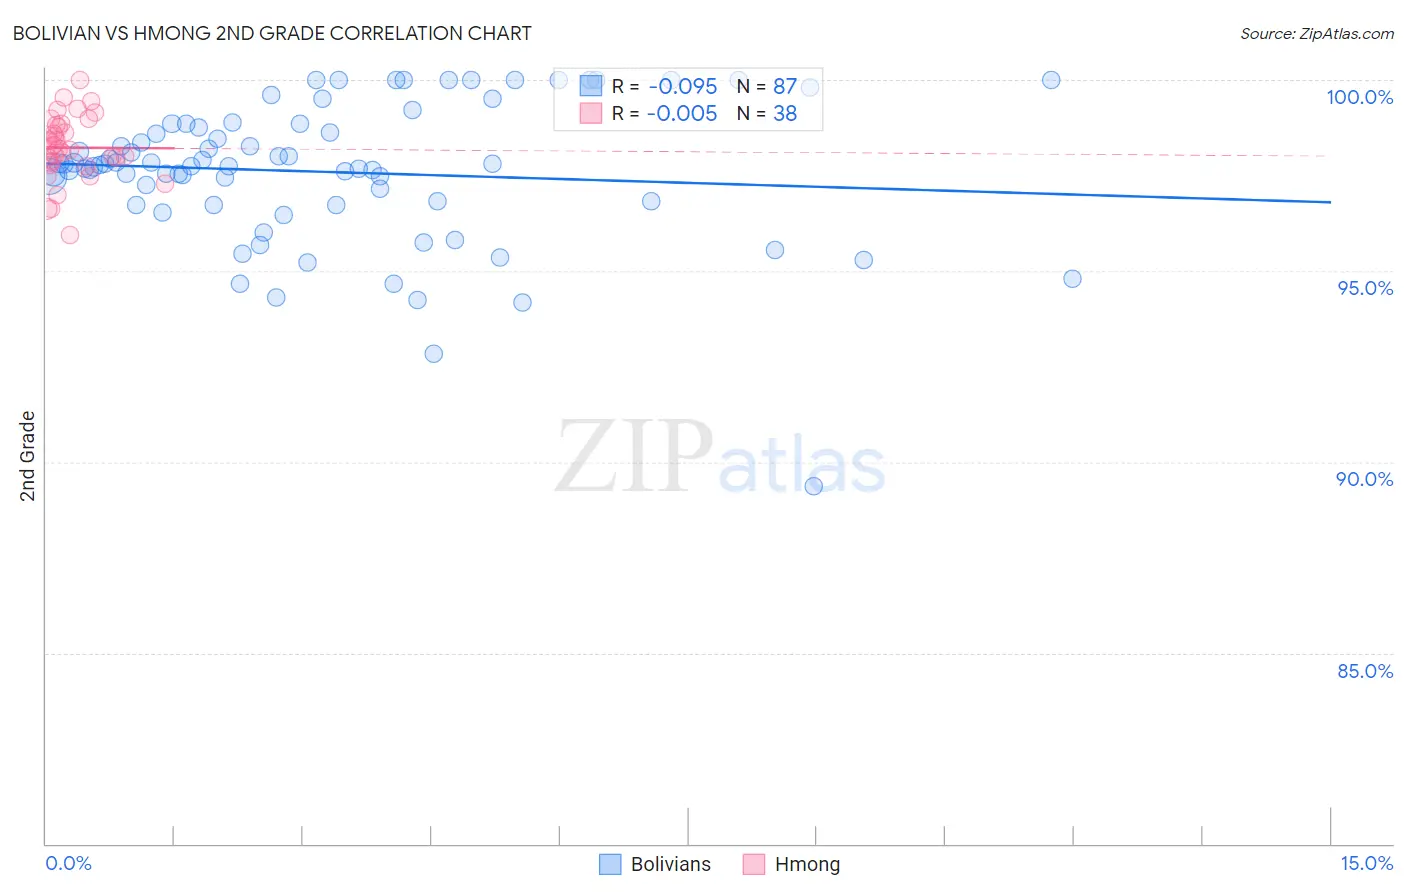
Bolivian vs Hmong 2nd Grade Correlation Chart
The statistical analysis conducted on geographies consisting of 184,667,361 people shows a slight negative correlation between the proportion of Bolivians and percentage of population with at least 2nd grade education in the United States with a correlation coefficient (R) of -0.095 and weighted average of 97.5%. Similarly, the statistical analysis conducted on geographies consisting of 24,672,093 people shows no correlation between the proportion of Hmong and percentage of population with at least 2nd grade education in the United States with a correlation coefficient (R) of -0.005 and weighted average of 98.0%, a difference of 0.48%.
2nd Grade Correlation Summary
| Measurement | Bolivian | Hmong |
| Minimum | 89.3% | 95.9% |
| Maximum | 100.0% | 100.0% |
| Range | 10.7% | 4.1% |
| Mean | 97.6% | 98.2% |
| Median | 97.8% | 98.2% |
| Interquartile 25% (IQ1) | 96.7% | 97.8% |
| Interquartile 75% (IQ3) | 98.8% | 98.8% |
| Interquartile Range (IQR) | 2.1% | 0.98% |
| Standard Deviation (Sample) | 1.9% | 0.85% |
| Standard Deviation (Population) | 1.9% | 0.84% |
Similar Demographics by 2nd Grade
Demographics Similar to Bolivians by 2nd Grade
In terms of 2nd grade, the demographic groups most similar to Bolivians are South American (97.5%, a difference of 0.0%), Immigrants from Senegal (97.5%, a difference of 0.0%), Immigrants from Middle Africa (97.5%, a difference of 0.0%), Peruvian (97.5%, a difference of 0.0%), and Immigrants from Iraq (97.5%, a difference of 0.010%).
| Demographics | Rating | Rank | 2nd Grade |
| Immigrants | Indonesia | 1.2 /100 | #242 | Tragic 97.5% |
| Asians | 1.1 /100 | #243 | Tragic 97.5% |
| Immigrants | Iraq | 1.0 /100 | #244 | Tragic 97.5% |
| Immigrants | Eastern Africa | 0.9 /100 | #245 | Tragic 97.5% |
| South Americans | 0.9 /100 | #246 | Tragic 97.5% |
| Immigrants | Senegal | 0.9 /100 | #247 | Tragic 97.5% |
| Immigrants | Middle Africa | 0.9 /100 | #248 | Tragic 97.5% |
| Bolivians | 0.9 /100 | #249 | Tragic 97.5% |
| Peruvians | 0.9 /100 | #250 | Tragic 97.5% |
| Immigrants | Africa | 0.8 /100 | #251 | Tragic 97.5% |
| Immigrants | Asia | 0.7 /100 | #252 | Tragic 97.5% |
| Puerto Ricans | 0.7 /100 | #253 | Tragic 97.5% |
| Indians (Asian) | 0.6 /100 | #254 | Tragic 97.5% |
| Immigrants | Congo | 0.6 /100 | #255 | Tragic 97.5% |
| Jamaicans | 0.6 /100 | #256 | Tragic 97.5% |
Demographics Similar to Hmong by 2nd Grade
In terms of 2nd grade, the demographic groups most similar to Hmong are Alsatian (98.0%, a difference of 0.0%), Filipino (98.0%, a difference of 0.0%), Burmese (98.0%, a difference of 0.010%), Immigrants from Israel (98.0%, a difference of 0.010%), and Immigrants from Greece (98.0%, a difference of 0.010%).
| Demographics | Rating | Rank | 2nd Grade |
| Immigrants | Romania | 88.3 /100 | #137 | Excellent 98.0% |
| Israelis | 87.9 /100 | #138 | Excellent 98.0% |
| Blackfeet | 87.5 /100 | #139 | Excellent 98.0% |
| Palestinians | 83.9 /100 | #140 | Excellent 98.0% |
| Immigrants | Turkey | 83.0 /100 | #141 | Excellent 98.0% |
| Burmese | 81.0 /100 | #142 | Excellent 98.0% |
| Alsatians | 80.5 /100 | #143 | Excellent 98.0% |
| Hmong | 80.0 /100 | #144 | Good 98.0% |
| Filipinos | 79.2 /100 | #145 | Good 98.0% |
| Immigrants | Israel | 78.0 /100 | #146 | Good 98.0% |
| Immigrants | Greece | 76.8 /100 | #147 | Good 98.0% |
| Jordanians | 74.5 /100 | #148 | Good 98.0% |
| Apache | 74.0 /100 | #149 | Good 97.9% |
| Immigrants | Moldova | 72.9 /100 | #150 | Good 97.9% |
| Soviet Union | 70.7 /100 | #151 | Good 97.9% |