Syrian vs Scotch-Irish 2nd Grade
COMPARE
Syrian
Scotch-Irish
2nd Grade
2nd Grade Comparison
Syrians
Scotch-Irish
98.1%
2ND GRADE
94.0/ 100
METRIC RATING
126th/ 347
METRIC RANK
98.5%
2ND GRADE
100.0/ 100
METRIC RATING
25th/ 347
METRIC RANK
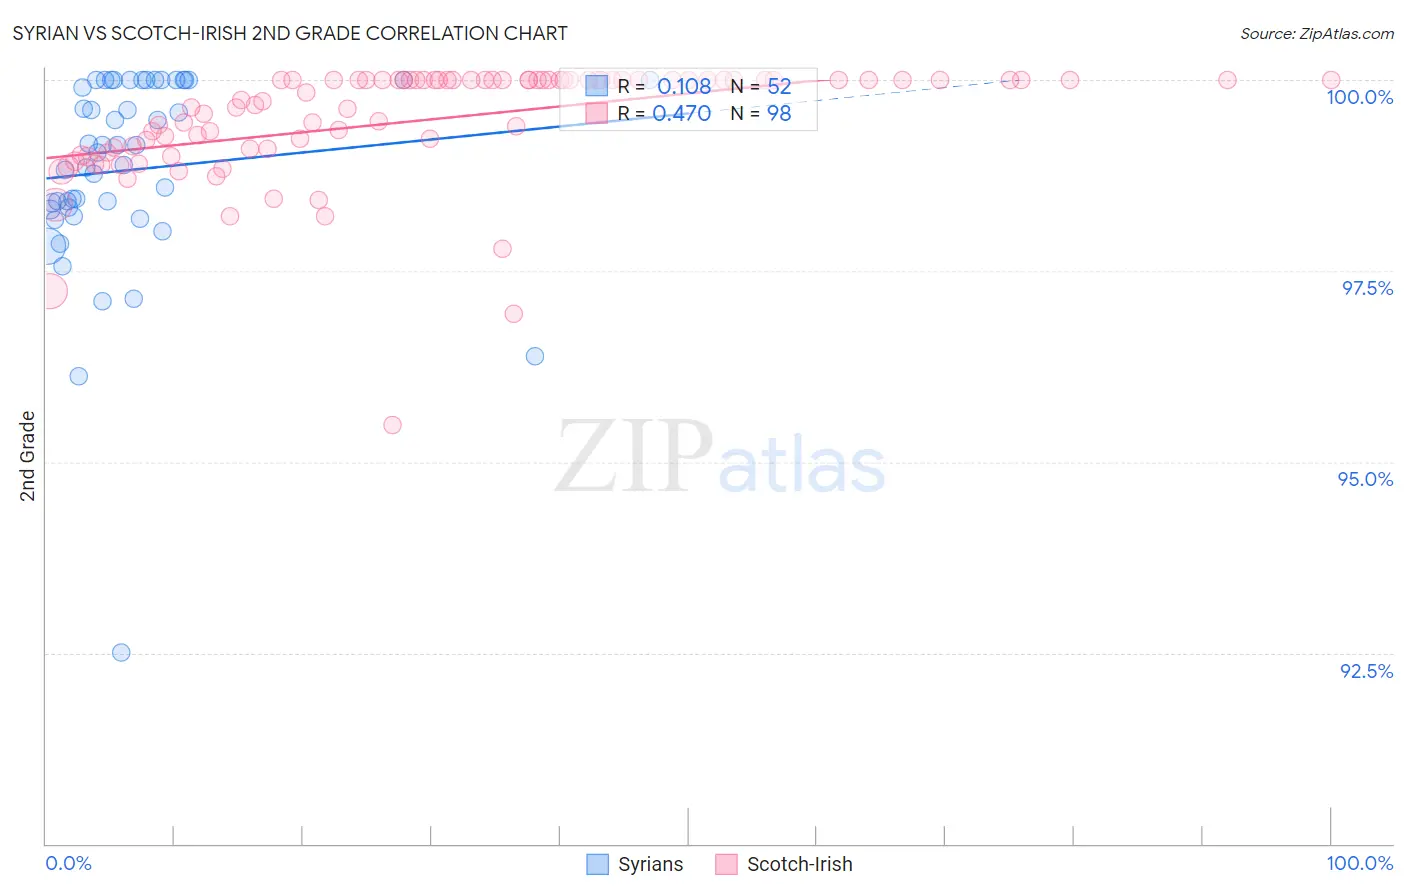
Syrian vs Scotch-Irish 2nd Grade Correlation Chart
The statistical analysis conducted on geographies consisting of 266,305,988 people shows a poor positive correlation between the proportion of Syrians and percentage of population with at least 2nd grade education in the United States with a correlation coefficient (R) of 0.108 and weighted average of 98.1%. Similarly, the statistical analysis conducted on geographies consisting of 548,777,407 people shows a moderate positive correlation between the proportion of Scotch-Irish and percentage of population with at least 2nd grade education in the United States with a correlation coefficient (R) of 0.470 and weighted average of 98.5%, a difference of 0.47%.
2nd Grade Correlation Summary
| Measurement | Syrian | Scotch-Irish |
| Minimum | 92.5% | 95.5% |
| Maximum | 100.0% | 100.0% |
| Range | 7.5% | 4.5% |
| Mean | 98.8% | 99.5% |
| Median | 99.1% | 99.9% |
| Interquartile 25% (IQ1) | 98.3% | 99.1% |
| Interquartile 75% (IQ3) | 100.0% | 100.0% |
| Interquartile Range (IQR) | 1.7% | 0.90% |
| Standard Deviation (Sample) | 1.3% | 0.77% |
| Standard Deviation (Population) | 1.3% | 0.76% |
Similar Demographics by 2nd Grade
Demographics Similar to Syrians by 2nd Grade
In terms of 2nd grade, the demographic groups most similar to Syrians are Lebanese (98.1%, a difference of 0.0%), Immigrants from Japan (98.1%, a difference of 0.0%), Menominee (98.1%, a difference of 0.0%), Iroquois (98.1%, a difference of 0.0%), and Okinawan (98.1%, a difference of 0.010%).
| Demographics | Rating | Rank | 2nd Grade |
| Thais | 95.3 /100 | #119 | Exceptional 98.1% |
| Okinawans | 94.9 /100 | #120 | Exceptional 98.1% |
| Immigrants | Zimbabwe | 94.4 /100 | #121 | Exceptional 98.1% |
| Lebanese | 94.2 /100 | #122 | Exceptional 98.1% |
| Immigrants | Japan | 94.1 /100 | #123 | Exceptional 98.1% |
| Menominee | 94.1 /100 | #124 | Exceptional 98.1% |
| Iroquois | 94.1 /100 | #125 | Exceptional 98.1% |
| Syrians | 94.0 /100 | #126 | Exceptional 98.1% |
| Immigrants | Saudi Arabia | 93.6 /100 | #127 | Exceptional 98.1% |
| Immigrants | Serbia | 92.3 /100 | #128 | Exceptional 98.1% |
| Immigrants | Croatia | 92.1 /100 | #129 | Exceptional 98.1% |
| Seminole | 91.1 /100 | #130 | Exceptional 98.0% |
| Immigrants | Europe | 91.1 /100 | #131 | Exceptional 98.0% |
| Spaniards | 90.7 /100 | #132 | Exceptional 98.0% |
| Cambodians | 90.7 /100 | #133 | Exceptional 98.0% |
Demographics Similar to Scotch-Irish by 2nd Grade
In terms of 2nd grade, the demographic groups most similar to Scotch-Irish are Polish (98.5%, a difference of 0.0%), Danish (98.5%, a difference of 0.0%), Pennsylvania German (98.5%, a difference of 0.0%), Finnish (98.5%, a difference of 0.010%), and Sioux (98.5%, a difference of 0.010%).
| Demographics | Rating | Rank | 2nd Grade |
| Irish | 100.0 /100 | #18 | Exceptional 98.6% |
| Finns | 100.0 /100 | #19 | Exceptional 98.5% |
| Sioux | 100.0 /100 | #20 | Exceptional 98.5% |
| Lithuanians | 100.0 /100 | #21 | Exceptional 98.5% |
| Poles | 100.0 /100 | #22 | Exceptional 98.5% |
| Danes | 100.0 /100 | #23 | Exceptional 98.5% |
| Pennsylvania Germans | 100.0 /100 | #24 | Exceptional 98.5% |
| Scotch-Irish | 100.0 /100 | #25 | Exceptional 98.5% |
| Welsh | 100.0 /100 | #26 | Exceptional 98.5% |
| Croatians | 100.0 /100 | #27 | Exceptional 98.5% |
| Arapaho | 100.0 /100 | #28 | Exceptional 98.5% |
| French | 100.0 /100 | #29 | Exceptional 98.5% |
| Europeans | 100.0 /100 | #30 | Exceptional 98.5% |
| Czechs | 100.0 /100 | #31 | Exceptional 98.5% |
| French Canadians | 100.0 /100 | #32 | Exceptional 98.5% |