Albanian vs Hmong 2nd Grade
COMPARE
Albanian
Hmong
2nd Grade
2nd Grade Comparison
Albanians
Hmong
97.9%
2ND GRADE
52.8/ 100
METRIC RATING
171st/ 347
METRIC RANK
98.0%
2ND GRADE
80.0/ 100
METRIC RATING
144th/ 347
METRIC RANK
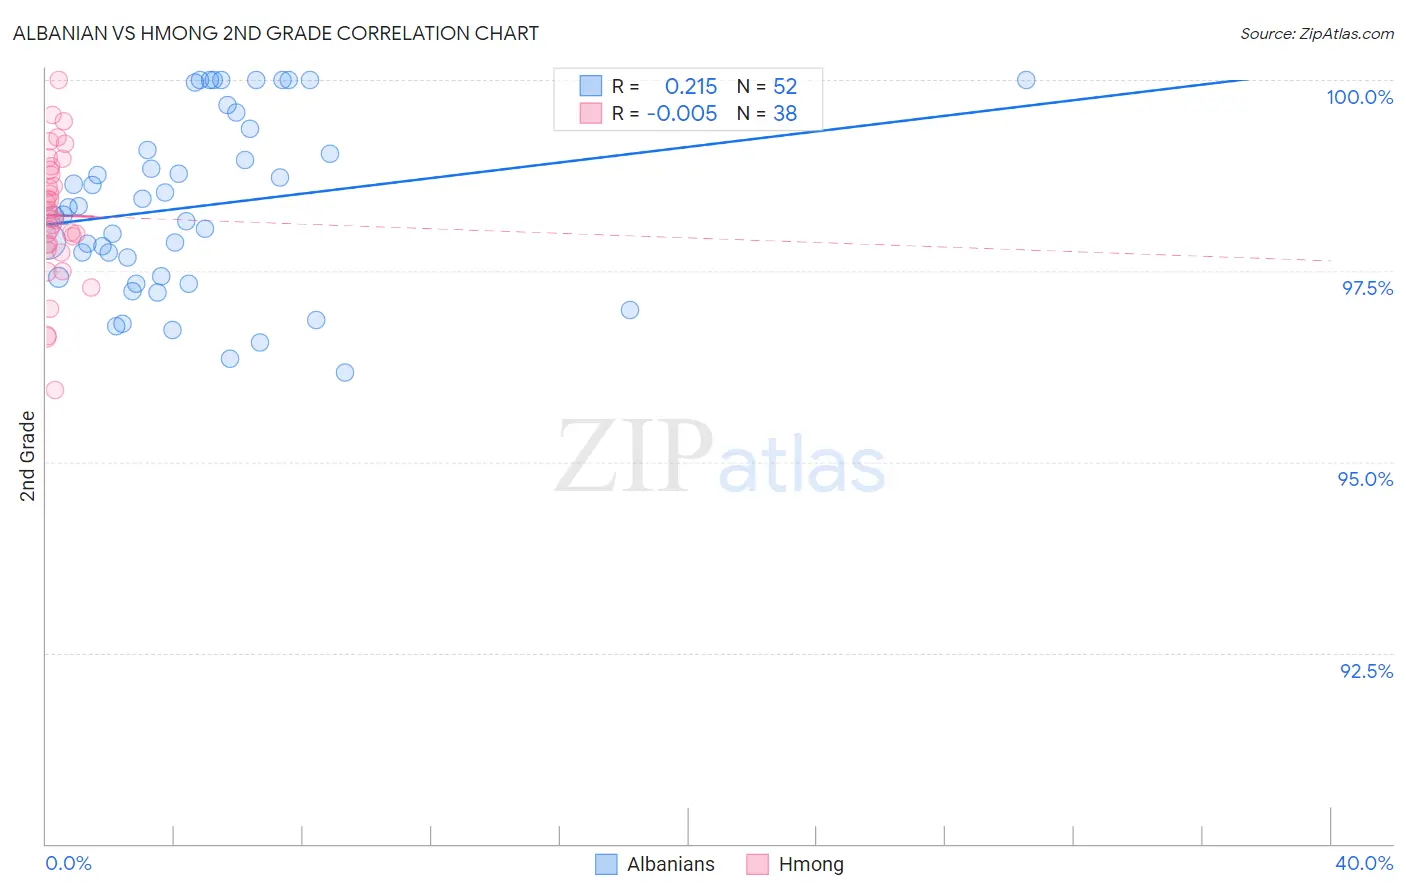
Albanian vs Hmong 2nd Grade Correlation Chart
The statistical analysis conducted on geographies consisting of 193,265,850 people shows a weak positive correlation between the proportion of Albanians and percentage of population with at least 2nd grade education in the United States with a correlation coefficient (R) of 0.215 and weighted average of 97.9%. Similarly, the statistical analysis conducted on geographies consisting of 24,672,093 people shows no correlation between the proportion of Hmong and percentage of population with at least 2nd grade education in the United States with a correlation coefficient (R) of -0.005 and weighted average of 98.0%, a difference of 0.10%.
2nd Grade Correlation Summary
| Measurement | Albanian | Hmong |
| Minimum | 96.2% | 95.9% |
| Maximum | 100.0% | 100.0% |
| Range | 3.8% | 4.1% |
| Mean | 98.3% | 98.2% |
| Median | 98.3% | 98.2% |
| Interquartile 25% (IQ1) | 97.4% | 97.8% |
| Interquartile 75% (IQ3) | 99.2% | 98.8% |
| Interquartile Range (IQR) | 1.8% | 0.98% |
| Standard Deviation (Sample) | 1.1% | 0.85% |
| Standard Deviation (Population) | 1.1% | 0.84% |
Similar Demographics by 2nd Grade
Demographics Similar to Albanians by 2nd Grade
In terms of 2nd grade, the demographic groups most similar to Albanians are Navajo (97.9%, a difference of 0.0%), Immigrants from Korea (97.9%, a difference of 0.0%), Kenyan (97.9%, a difference of 0.0%), Ugandan (97.9%, a difference of 0.010%), and Spanish American (97.9%, a difference of 0.010%).
| Demographics | Rating | Rank | 2nd Grade |
| Ugandans | 56.6 /100 | #164 | Average 97.9% |
| Spanish Americans | 56.4 /100 | #165 | Average 97.9% |
| Immigrants | Jordan | 56.3 /100 | #166 | Average 97.9% |
| Chileans | 56.1 /100 | #167 | Average 97.9% |
| Brazilians | 55.8 /100 | #168 | Average 97.9% |
| Immigrants | Spain | 55.4 /100 | #169 | Average 97.9% |
| Navajo | 54.3 /100 | #170 | Average 97.9% |
| Albanians | 52.8 /100 | #171 | Average 97.9% |
| Immigrants | Korea | 52.7 /100 | #172 | Average 97.9% |
| Kenyans | 52.7 /100 | #173 | Average 97.9% |
| Immigrants | Micronesia | 50.0 /100 | #174 | Average 97.9% |
| Immigrants | Bosnia and Herzegovina | 49.8 /100 | #175 | Average 97.9% |
| Immigrants | Sri Lanka | 48.7 /100 | #176 | Average 97.9% |
| Immigrants | Brazil | 46.6 /100 | #177 | Average 97.9% |
| Argentineans | 46.3 /100 | #178 | Average 97.9% |
Demographics Similar to Hmong by 2nd Grade
In terms of 2nd grade, the demographic groups most similar to Hmong are Alsatian (98.0%, a difference of 0.0%), Filipino (98.0%, a difference of 0.0%), Burmese (98.0%, a difference of 0.010%), Immigrants from Israel (98.0%, a difference of 0.010%), and Immigrants from Greece (98.0%, a difference of 0.010%).
| Demographics | Rating | Rank | 2nd Grade |
| Immigrants | Romania | 88.3 /100 | #137 | Excellent 98.0% |
| Israelis | 87.9 /100 | #138 | Excellent 98.0% |
| Blackfeet | 87.5 /100 | #139 | Excellent 98.0% |
| Palestinians | 83.9 /100 | #140 | Excellent 98.0% |
| Immigrants | Turkey | 83.0 /100 | #141 | Excellent 98.0% |
| Burmese | 81.0 /100 | #142 | Excellent 98.0% |
| Alsatians | 80.5 /100 | #143 | Excellent 98.0% |
| Hmong | 80.0 /100 | #144 | Good 98.0% |
| Filipinos | 79.2 /100 | #145 | Good 98.0% |
| Immigrants | Israel | 78.0 /100 | #146 | Good 98.0% |
| Immigrants | Greece | 76.8 /100 | #147 | Good 98.0% |
| Jordanians | 74.5 /100 | #148 | Good 98.0% |
| Apache | 74.0 /100 | #149 | Good 97.9% |
| Immigrants | Moldova | 72.9 /100 | #150 | Good 97.9% |
| Soviet Union | 70.7 /100 | #151 | Good 97.9% |