Syrian vs Crow 2nd Grade
COMPARE
Syrian
Crow
2nd Grade
2nd Grade Comparison
Syrians
Crow
98.1%
2ND GRADE
94.0/ 100
METRIC RATING
126th/ 347
METRIC RANK
99.6%
2ND GRADE
100.0/ 100
METRIC RATING
1st/ 347
METRIC RANK
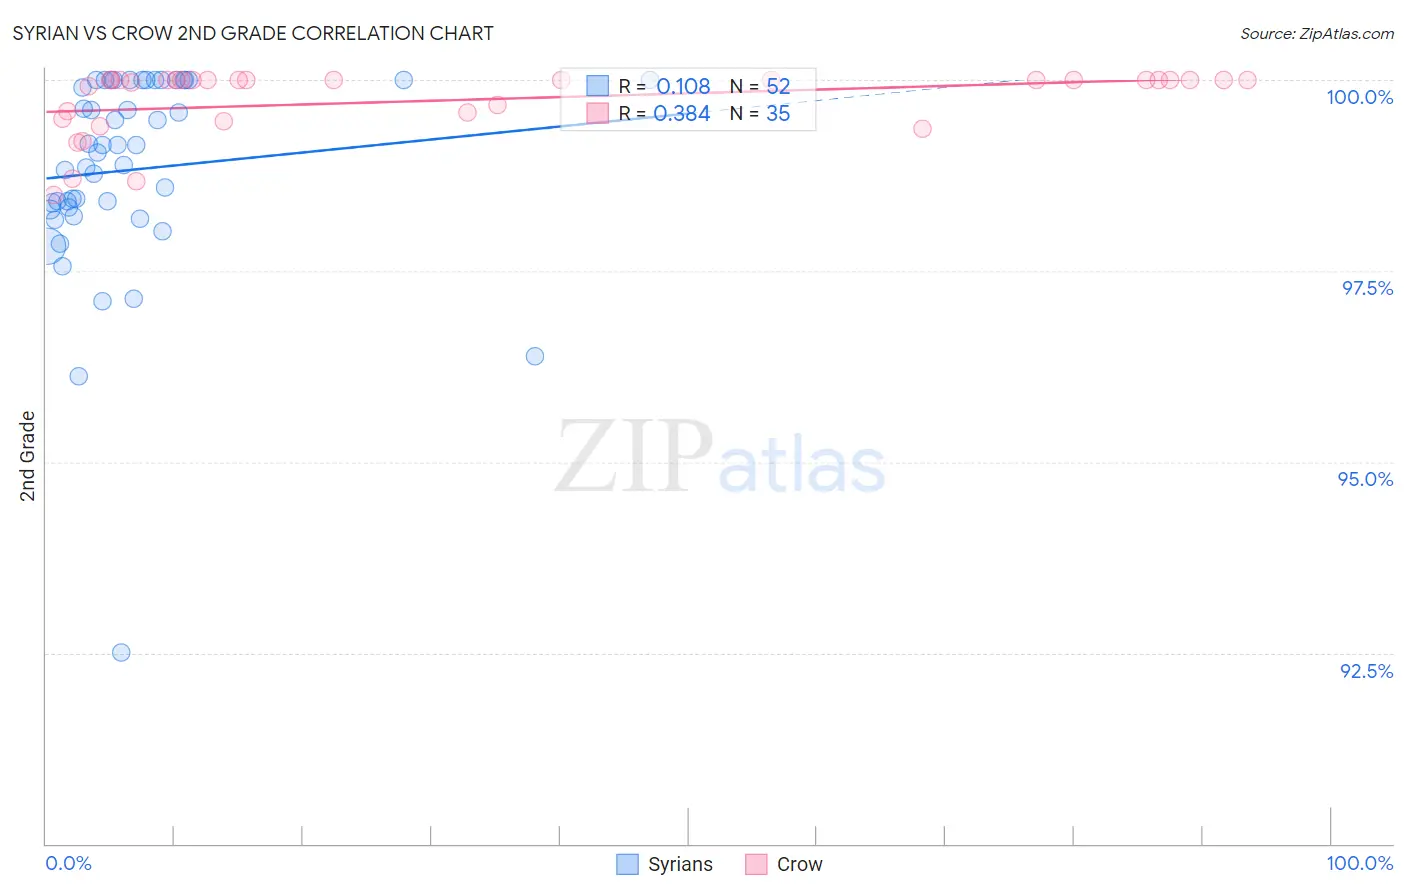
Syrian vs Crow 2nd Grade Correlation Chart
The statistical analysis conducted on geographies consisting of 266,305,988 people shows a poor positive correlation between the proportion of Syrians and percentage of population with at least 2nd grade education in the United States with a correlation coefficient (R) of 0.108 and weighted average of 98.1%. Similarly, the statistical analysis conducted on geographies consisting of 665,246 people shows a mild positive correlation between the proportion of Crow and percentage of population with at least 2nd grade education in the United States with a correlation coefficient (R) of 0.384 and weighted average of 99.6%, a difference of 1.6%.
2nd Grade Correlation Summary
| Measurement | Syrian | Crow |
| Minimum | 92.5% | 98.5% |
| Maximum | 100.0% | 100.0% |
| Range | 7.5% | 1.5% |
| Mean | 98.8% | 99.7% |
| Median | 99.1% | 100.0% |
| Interquartile 25% (IQ1) | 98.3% | 99.5% |
| Interquartile 75% (IQ3) | 100.0% | 100.0% |
| Interquartile Range (IQR) | 1.7% | 0.50% |
| Standard Deviation (Sample) | 1.3% | 0.43% |
| Standard Deviation (Population) | 1.3% | 0.42% |
Similar Demographics by 2nd Grade
Demographics Similar to Syrians by 2nd Grade
In terms of 2nd grade, the demographic groups most similar to Syrians are Lebanese (98.1%, a difference of 0.0%), Immigrants from Japan (98.1%, a difference of 0.0%), Menominee (98.1%, a difference of 0.0%), Iroquois (98.1%, a difference of 0.0%), and Okinawan (98.1%, a difference of 0.010%).
| Demographics | Rating | Rank | 2nd Grade |
| Thais | 95.3 /100 | #119 | Exceptional 98.1% |
| Okinawans | 94.9 /100 | #120 | Exceptional 98.1% |
| Immigrants | Zimbabwe | 94.4 /100 | #121 | Exceptional 98.1% |
| Lebanese | 94.2 /100 | #122 | Exceptional 98.1% |
| Immigrants | Japan | 94.1 /100 | #123 | Exceptional 98.1% |
| Menominee | 94.1 /100 | #124 | Exceptional 98.1% |
| Iroquois | 94.1 /100 | #125 | Exceptional 98.1% |
| Syrians | 94.0 /100 | #126 | Exceptional 98.1% |
| Immigrants | Saudi Arabia | 93.6 /100 | #127 | Exceptional 98.1% |
| Immigrants | Serbia | 92.3 /100 | #128 | Exceptional 98.1% |
| Immigrants | Croatia | 92.1 /100 | #129 | Exceptional 98.1% |
| Seminole | 91.1 /100 | #130 | Exceptional 98.0% |
| Immigrants | Europe | 91.1 /100 | #131 | Exceptional 98.0% |
| Spaniards | 90.7 /100 | #132 | Exceptional 98.0% |
| Cambodians | 90.7 /100 | #133 | Exceptional 98.0% |
Demographics Similar to Crow by 2nd Grade
In terms of 2nd grade, the demographic groups most similar to Crow are Yup'ik (99.2%, a difference of 0.49%), Inupiat (98.8%, a difference of 0.81%), Tsimshian (98.8%, a difference of 0.85%), Alaskan Athabascan (98.7%, a difference of 0.92%), and Alaska Native (98.7%, a difference of 0.97%).
| Demographics | Rating | Rank | 2nd Grade |
| Crow | 100.0 /100 | #1 | Exceptional 99.6% |
| Yup'ik | 100.0 /100 | #2 | Exceptional 99.2% |
| Inupiat | 100.0 /100 | #3 | Exceptional 98.8% |
| Tsimshian | 100.0 /100 | #4 | Exceptional 98.8% |
| Alaskan Athabascans | 100.0 /100 | #5 | Exceptional 98.7% |
| Alaska Natives | 100.0 /100 | #6 | Exceptional 98.7% |
| Norwegians | 100.0 /100 | #7 | Exceptional 98.7% |
| Germans | 100.0 /100 | #8 | Exceptional 98.7% |
| Slovaks | 100.0 /100 | #9 | Exceptional 98.7% |
| Slovenes | 100.0 /100 | #10 | Exceptional 98.6% |
| Tlingit-Haida | 100.0 /100 | #11 | Exceptional 98.6% |
| Carpatho Rusyns | 100.0 /100 | #12 | Exceptional 98.6% |
| English | 100.0 /100 | #13 | Exceptional 98.6% |
| Swedes | 100.0 /100 | #14 | Exceptional 98.6% |
| Scottish | 100.0 /100 | #15 | Exceptional 98.6% |