Ottawa vs Hmong 2nd Grade
COMPARE
Ottawa
Hmong
2nd Grade
2nd Grade Comparison
Ottawa
Hmong
98.4%
2ND GRADE
99.9/ 100
METRIC RATING
47th/ 347
METRIC RANK
98.0%
2ND GRADE
80.0/ 100
METRIC RATING
144th/ 347
METRIC RANK
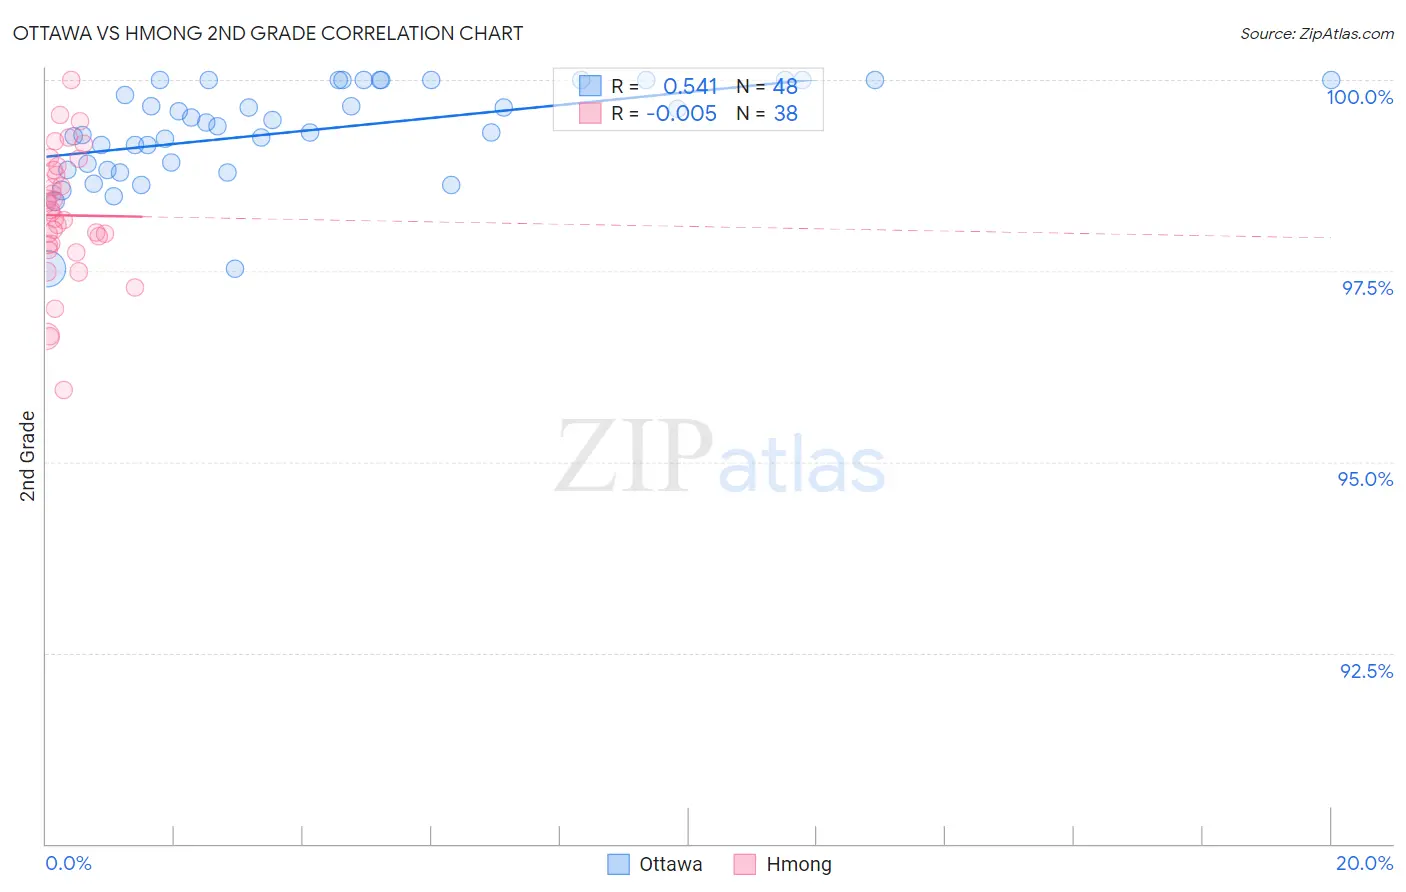
Ottawa vs Hmong 2nd Grade Correlation Chart
The statistical analysis conducted on geographies consisting of 49,956,726 people shows a substantial positive correlation between the proportion of Ottawa and percentage of population with at least 2nd grade education in the United States with a correlation coefficient (R) of 0.541 and weighted average of 98.4%. Similarly, the statistical analysis conducted on geographies consisting of 24,672,093 people shows no correlation between the proportion of Hmong and percentage of population with at least 2nd grade education in the United States with a correlation coefficient (R) of -0.005 and weighted average of 98.0%, a difference of 0.41%.
2nd Grade Correlation Summary
| Measurement | Ottawa | Hmong |
| Minimum | 97.5% | 95.9% |
| Maximum | 100.0% | 100.0% |
| Range | 2.5% | 4.1% |
| Mean | 99.3% | 98.2% |
| Median | 99.4% | 98.2% |
| Interquartile 25% (IQ1) | 98.9% | 97.8% |
| Interquartile 75% (IQ3) | 100.0% | 98.8% |
| Interquartile Range (IQR) | 1.1% | 0.98% |
| Standard Deviation (Sample) | 0.63% | 0.85% |
| Standard Deviation (Population) | 0.63% | 0.84% |
Similar Demographics by 2nd Grade
Demographics Similar to Ottawa by 2nd Grade
In terms of 2nd grade, the demographic groups most similar to Ottawa are Czechoslovakian (98.4%, a difference of 0.0%), Hungarian (98.4%, a difference of 0.010%), Lumbee (98.4%, a difference of 0.010%), Celtic (98.4%, a difference of 0.020%), and White/Caucasian (98.4%, a difference of 0.020%).
| Demographics | Rating | Rank | 2nd Grade |
| Luxembourgers | 99.9 /100 | #40 | Exceptional 98.4% |
| Eastern Europeans | 99.9 /100 | #41 | Exceptional 98.4% |
| Native Hawaiians | 99.9 /100 | #42 | Exceptional 98.4% |
| Belgians | 99.9 /100 | #43 | Exceptional 98.4% |
| Northern Europeans | 99.9 /100 | #44 | Exceptional 98.4% |
| Hungarians | 99.9 /100 | #45 | Exceptional 98.4% |
| Lumbee | 99.9 /100 | #46 | Exceptional 98.4% |
| Ottawa | 99.9 /100 | #47 | Exceptional 98.4% |
| Czechoslovakians | 99.9 /100 | #48 | Exceptional 98.4% |
| Celtics | 99.8 /100 | #49 | Exceptional 98.4% |
| Whites/Caucasians | 99.8 /100 | #50 | Exceptional 98.4% |
| Estonians | 99.8 /100 | #51 | Exceptional 98.4% |
| Australians | 99.8 /100 | #52 | Exceptional 98.4% |
| Pueblo | 99.8 /100 | #53 | Exceptional 98.3% |
| Kiowa | 99.8 /100 | #54 | Exceptional 98.3% |
Demographics Similar to Hmong by 2nd Grade
In terms of 2nd grade, the demographic groups most similar to Hmong are Alsatian (98.0%, a difference of 0.0%), Filipino (98.0%, a difference of 0.0%), Burmese (98.0%, a difference of 0.010%), Immigrants from Israel (98.0%, a difference of 0.010%), and Immigrants from Greece (98.0%, a difference of 0.010%).
| Demographics | Rating | Rank | 2nd Grade |
| Immigrants | Romania | 88.3 /100 | #137 | Excellent 98.0% |
| Israelis | 87.9 /100 | #138 | Excellent 98.0% |
| Blackfeet | 87.5 /100 | #139 | Excellent 98.0% |
| Palestinians | 83.9 /100 | #140 | Excellent 98.0% |
| Immigrants | Turkey | 83.0 /100 | #141 | Excellent 98.0% |
| Burmese | 81.0 /100 | #142 | Excellent 98.0% |
| Alsatians | 80.5 /100 | #143 | Excellent 98.0% |
| Hmong | 80.0 /100 | #144 | Good 98.0% |
| Filipinos | 79.2 /100 | #145 | Good 98.0% |
| Immigrants | Israel | 78.0 /100 | #146 | Good 98.0% |
| Immigrants | Greece | 76.8 /100 | #147 | Good 98.0% |
| Jordanians | 74.5 /100 | #148 | Good 98.0% |
| Apache | 74.0 /100 | #149 | Good 97.9% |
| Immigrants | Moldova | 72.9 /100 | #150 | Good 97.9% |
| Soviet Union | 70.7 /100 | #151 | Good 97.9% |