Swiss vs Immigrants College, Under 1 year
COMPARE
Swiss
Immigrants
College, Under 1 year
College, Under 1 year Comparison
Swiss
Immigrants
65.5%
COLLEGE, UNDER 1 YEAR
53.9/ 100
METRIC RATING
173rd/ 347
METRIC RANK
62.5%
COLLEGE, UNDER 1 YEAR
1.7/ 100
METRIC RATING
236th/ 347
METRIC RANK
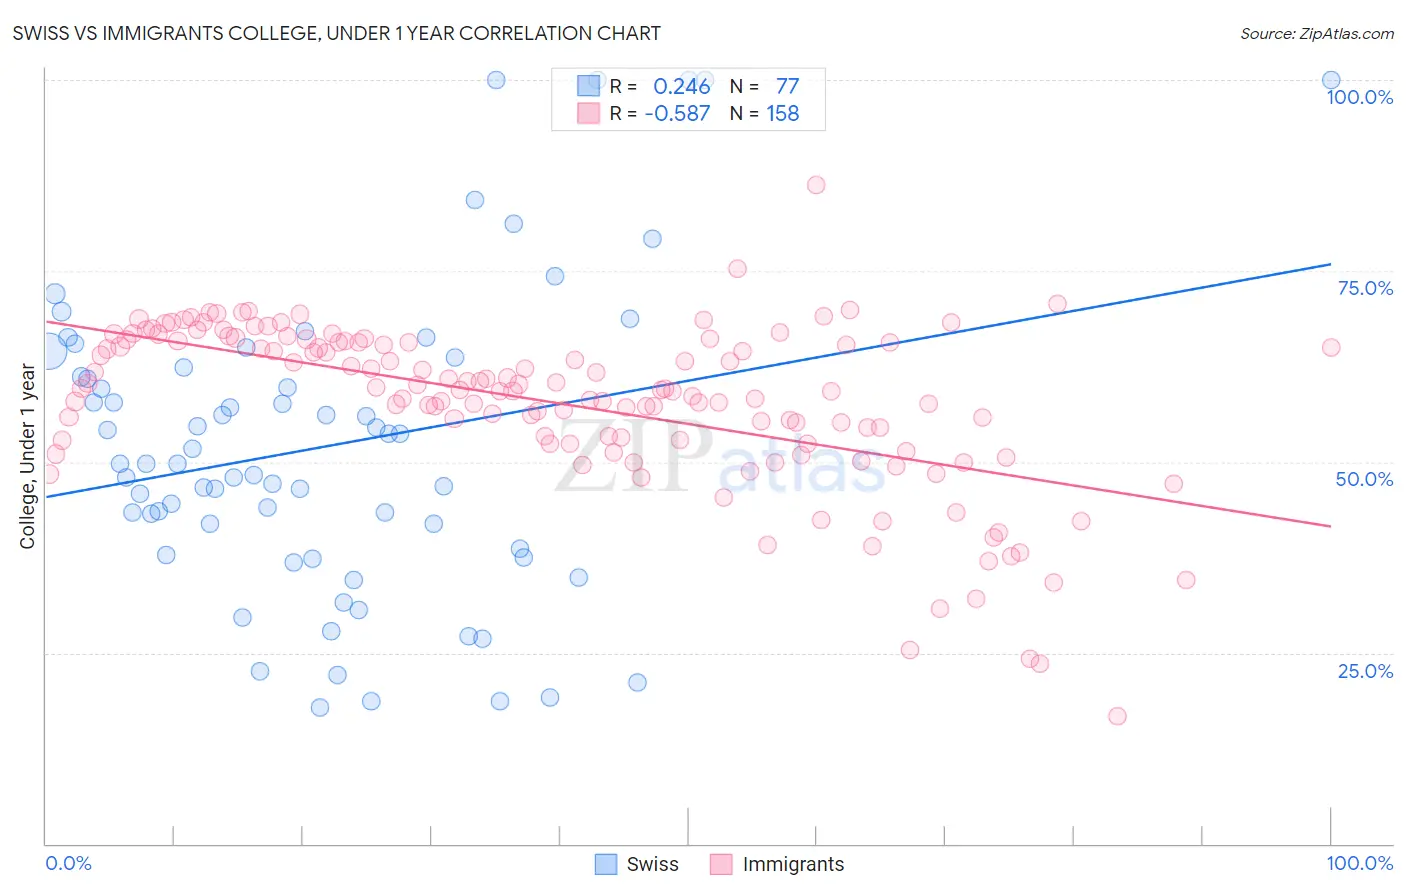
Swiss vs Immigrants College, Under 1 year Correlation Chart
The statistical analysis conducted on geographies consisting of 465,017,987 people shows a weak positive correlation between the proportion of Swiss and percentage of population with at least college, under 1 year education in the United States with a correlation coefficient (R) of 0.246 and weighted average of 65.5%. Similarly, the statistical analysis conducted on geographies consisting of 577,770,427 people shows a substantial negative correlation between the proportion of Immigrants and percentage of population with at least college, under 1 year education in the United States with a correlation coefficient (R) of -0.587 and weighted average of 62.5%, a difference of 4.9%.
College, Under 1 year Correlation Summary
| Measurement | Swiss | Immigrants |
| Minimum | 17.9% | 16.7% |
| Maximum | 100.0% | 86.3% |
| Range | 82.1% | 69.7% |
| Mean | 52.0% | 57.6% |
| Median | 49.7% | 59.4% |
| Interquartile 25% (IQ1) | 38.2% | 52.9% |
| Interquartile 75% (IQ3) | 63.0% | 65.7% |
| Interquartile Range (IQR) | 24.8% | 12.8% |
| Standard Deviation (Sample) | 20.0% | 10.9% |
| Standard Deviation (Population) | 19.9% | 10.8% |
Similar Demographics by College, Under 1 year
Demographics Similar to Swiss by College, Under 1 year
In terms of college, under 1 year, the demographic groups most similar to Swiss are South American Indian (65.5%, a difference of 0.020%), Immigrants from Oceania (65.6%, a difference of 0.050%), Yugoslavian (65.6%, a difference of 0.080%), German (65.6%, a difference of 0.080%), and Hungarian (65.6%, a difference of 0.090%).
| Demographics | Rating | Rank | College, Under 1 year |
| Moroccans | 56.7 /100 | #166 | Average 65.6% |
| Immigrants | Somalia | 56.4 /100 | #167 | Average 65.6% |
| Hungarians | 55.9 /100 | #168 | Average 65.6% |
| Yugoslavians | 55.7 /100 | #169 | Average 65.6% |
| Germans | 55.7 /100 | #170 | Average 65.6% |
| Immigrants | Oceania | 55.0 /100 | #171 | Average 65.6% |
| South American Indians | 54.4 /100 | #172 | Average 65.5% |
| Swiss | 53.9 /100 | #173 | Average 65.5% |
| Immigrants | Bosnia and Herzegovina | 50.0 /100 | #174 | Average 65.4% |
| Scotch-Irish | 49.5 /100 | #175 | Average 65.4% |
| French | 48.9 /100 | #176 | Average 65.4% |
| Immigrants | North Macedonia | 48.6 /100 | #177 | Average 65.4% |
| German Russians | 48.3 /100 | #178 | Average 65.4% |
| Guamanians/Chamorros | 48.2 /100 | #179 | Average 65.4% |
| Dutch | 46.1 /100 | #180 | Average 65.3% |
Demographics Similar to Immigrants by College, Under 1 year
In terms of college, under 1 year, the demographic groups most similar to Immigrants are Immigrants from Burma/Myanmar (62.5%, a difference of 0.030%), French American Indian (62.4%, a difference of 0.12%), Spanish American (62.6%, a difference of 0.13%), Chippewa (62.6%, a difference of 0.18%), and Iroquois (62.6%, a difference of 0.21%).
| Demographics | Rating | Rank | College, Under 1 year |
| Liberians | 3.2 /100 | #229 | Tragic 63.0% |
| Immigrants | Nonimmigrants | 3.0 /100 | #230 | Tragic 62.9% |
| Immigrants | Western Africa | 2.4 /100 | #231 | Tragic 62.8% |
| Osage | 2.2 /100 | #232 | Tragic 62.7% |
| Iroquois | 2.0 /100 | #233 | Tragic 62.6% |
| Chippewa | 2.0 /100 | #234 | Tragic 62.6% |
| Spanish Americans | 1.9 /100 | #235 | Tragic 62.6% |
| Immigrants | Immigrants | 1.7 /100 | #236 | Tragic 62.5% |
| Immigrants | Burma/Myanmar | 1.6 /100 | #237 | Tragic 62.5% |
| French American Indians | 1.5 /100 | #238 | Tragic 62.4% |
| Nepalese | 1.1 /100 | #239 | Tragic 62.2% |
| Aleuts | 1.1 /100 | #240 | Tragic 62.2% |
| Ottawa | 1.1 /100 | #241 | Tragic 62.2% |
| Malaysians | 1.1 /100 | #242 | Tragic 62.2% |
| Hawaiians | 1.1 /100 | #243 | Tragic 62.1% |