Swiss vs Immigrants from Syria Ambulatory Disability
COMPARE
Swiss
Immigrants from Syria
Ambulatory Disability
Ambulatory Disability Comparison
Swiss
Immigrants from Syria
6.1%
AMBULATORY DISABILITY
43.1/ 100
METRIC RATING
181st/ 347
METRIC RANK
6.0%
AMBULATORY DISABILITY
84.1/ 100
METRIC RATING
137th/ 347
METRIC RANK
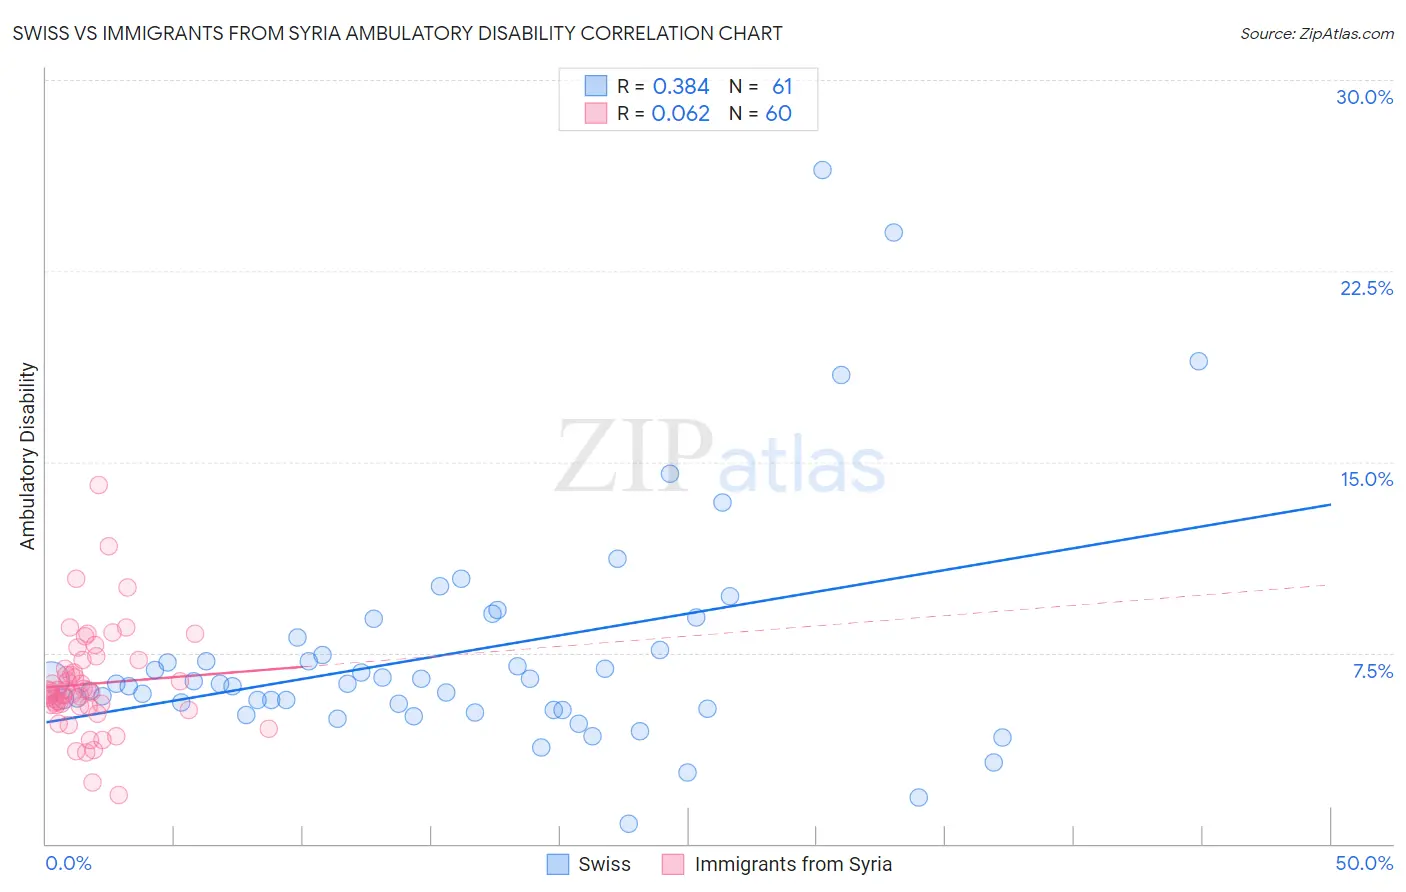
Swiss vs Immigrants from Syria Ambulatory Disability Correlation Chart
The statistical analysis conducted on geographies consisting of 464,822,088 people shows a mild positive correlation between the proportion of Swiss and percentage of population with ambulatory disability in the United States with a correlation coefficient (R) of 0.384 and weighted average of 6.1%. Similarly, the statistical analysis conducted on geographies consisting of 174,106,838 people shows a slight positive correlation between the proportion of Immigrants from Syria and percentage of population with ambulatory disability in the United States with a correlation coefficient (R) of 0.062 and weighted average of 6.0%, a difference of 2.6%.
Ambulatory Disability Correlation Summary
| Measurement | Swiss | Immigrants from Syria |
| Minimum | 0.81% | 1.9% |
| Maximum | 26.5% | 14.1% |
| Range | 25.7% | 12.1% |
| Mean | 7.5% | 6.3% |
| Median | 6.3% | 6.0% |
| Interquartile 25% (IQ1) | 5.3% | 5.4% |
| Interquartile 75% (IQ3) | 7.8% | 7.0% |
| Interquartile Range (IQR) | 2.6% | 1.6% |
| Standard Deviation (Sample) | 4.6% | 2.0% |
| Standard Deviation (Population) | 4.6% | 2.0% |
Similar Demographics by Ambulatory Disability
Demographics Similar to Swiss by Ambulatory Disability
In terms of ambulatory disability, the demographic groups most similar to Swiss are Serbian (6.1%, a difference of 0.010%), Immigrants from Nicaragua (6.1%, a difference of 0.040%), Austrian (6.1%, a difference of 0.050%), Immigrants from Thailand (6.1%, a difference of 0.050%), and Scandinavian (6.1%, a difference of 0.080%).
| Demographics | Rating | Rank | Ambulatory Disability |
| Immigrants | Canada | 50.0 /100 | #174 | Average 6.1% |
| Vietnamese | 47.2 /100 | #175 | Average 6.1% |
| Immigrants | North America | 45.6 /100 | #176 | Average 6.1% |
| Immigrants | England | 45.4 /100 | #177 | Average 6.1% |
| Scandinavians | 44.5 /100 | #178 | Average 6.1% |
| Austrians | 44.1 /100 | #179 | Average 6.1% |
| Immigrants | Nicaragua | 43.9 /100 | #180 | Average 6.1% |
| Swiss | 43.1 /100 | #181 | Average 6.1% |
| Serbians | 42.8 /100 | #182 | Average 6.1% |
| Immigrants | Thailand | 42.2 /100 | #183 | Average 6.1% |
| Immigrants | Ghana | 41.2 /100 | #184 | Average 6.1% |
| Immigrants | Bosnia and Herzegovina | 37.2 /100 | #185 | Fair 6.2% |
| Europeans | 36.2 /100 | #186 | Fair 6.2% |
| Carpatho Rusyns | 35.3 /100 | #187 | Fair 6.2% |
| British | 34.3 /100 | #188 | Fair 6.2% |
Demographics Similar to Immigrants from Syria by Ambulatory Disability
In terms of ambulatory disability, the demographic groups most similar to Immigrants from Syria are Immigrants from North Macedonia (6.0%, a difference of 0.0%), Immigrants from Hungary (6.0%, a difference of 0.020%), Immigrants from Zaire (6.0%, a difference of 0.050%), Czech (6.0%, a difference of 0.080%), and Immigrants from Italy (6.0%, a difference of 0.090%).
| Demographics | Rating | Rank | Ambulatory Disability |
| Immigrants | Kazakhstan | 89.7 /100 | #130 | Excellent 5.9% |
| Immigrants | Costa Rica | 89.5 /100 | #131 | Excellent 5.9% |
| Immigrants | Europe | 87.8 /100 | #132 | Excellent 6.0% |
| Immigrants | Immigrants | 86.9 /100 | #133 | Excellent 6.0% |
| Ute | 86.6 /100 | #134 | Excellent 6.0% |
| Immigrants | Italy | 85.0 /100 | #135 | Excellent 6.0% |
| Immigrants | North Macedonia | 84.1 /100 | #136 | Excellent 6.0% |
| Immigrants | Syria | 84.1 /100 | #137 | Excellent 6.0% |
| Immigrants | Hungary | 83.9 /100 | #138 | Excellent 6.0% |
| Immigrants | Zaire | 83.6 /100 | #139 | Excellent 6.0% |
| Czechs | 83.3 /100 | #140 | Excellent 6.0% |
| Swedes | 83.1 /100 | #141 | Excellent 6.0% |
| Immigrants | Philippines | 83.0 /100 | #142 | Excellent 6.0% |
| Romanians | 82.9 /100 | #143 | Excellent 6.0% |
| Macedonians | 82.8 /100 | #144 | Excellent 6.0% |