Swedish vs British West Indian Master's Degree
COMPARE
Swedish
British West Indian
Master's Degree
Master's Degree Comparison
Swedes
British West Indians
15.2%
MASTER'S DEGREE
66.1/ 100
METRIC RATING
166th/ 347
METRIC RANK
13.8%
MASTER'S DEGREE
8.8/ 100
METRIC RATING
229th/ 347
METRIC RANK
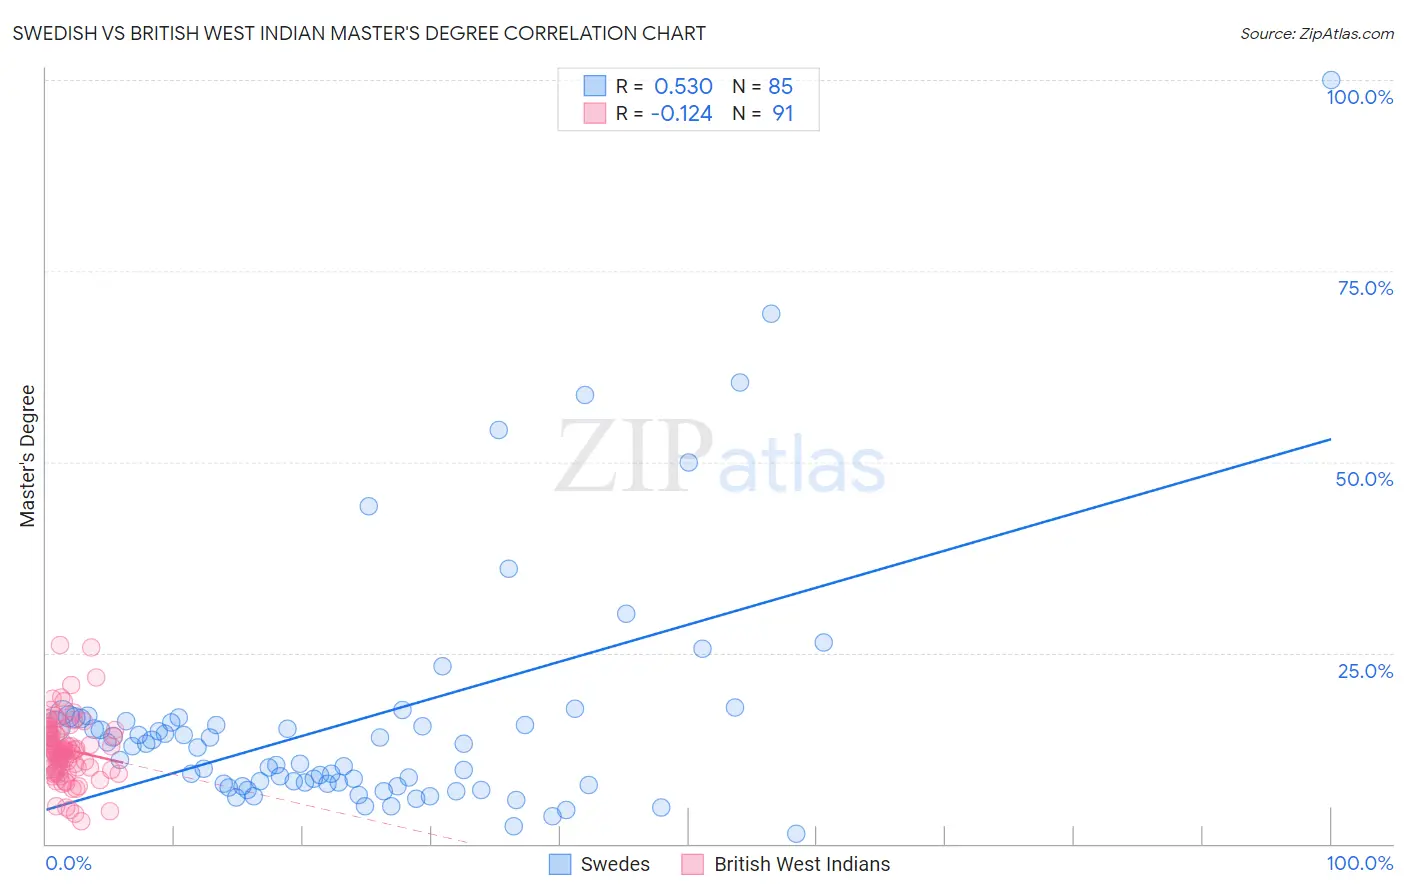
Swedish vs British West Indian Master's Degree Correlation Chart
The statistical analysis conducted on geographies consisting of 538,720,356 people shows a substantial positive correlation between the proportion of Swedes and percentage of population with at least master's degree education in the United States with a correlation coefficient (R) of 0.530 and weighted average of 15.2%. Similarly, the statistical analysis conducted on geographies consisting of 152,656,458 people shows a poor negative correlation between the proportion of British West Indians and percentage of population with at least master's degree education in the United States with a correlation coefficient (R) of -0.124 and weighted average of 13.8%, a difference of 10.4%.
Master's Degree Correlation Summary
| Measurement | Swedish | British West Indian |
| Minimum | 1.3% | 2.9% |
| Maximum | 100.0% | 26.0% |
| Range | 98.7% | 23.1% |
| Mean | 16.0% | 12.3% |
| Median | 12.6% | 12.2% |
| Interquartile 25% (IQ1) | 7.7% | 9.6% |
| Interquartile 75% (IQ3) | 16.2% | 14.8% |
| Interquartile Range (IQR) | 8.5% | 5.2% |
| Standard Deviation (Sample) | 15.9% | 4.2% |
| Standard Deviation (Population) | 15.8% | 4.2% |
Similar Demographics by Master's Degree
Demographics Similar to Swedes by Master's Degree
In terms of master's degree, the demographic groups most similar to Swedes are Immigrants from Kenya (15.3%, a difference of 0.070%), Senegalese (15.2%, a difference of 0.070%), Colombian (15.3%, a difference of 0.11%), Uruguayan (15.3%, a difference of 0.14%), and Immigrants from North Macedonia (15.2%, a difference of 0.22%).
| Demographics | Rating | Rank | Master's Degree |
| Luxembourgers | 71.0 /100 | #159 | Good 15.3% |
| Kenyans | 70.3 /100 | #160 | Good 15.3% |
| Sudanese | 68.7 /100 | #161 | Good 15.3% |
| Peruvians | 68.7 /100 | #162 | Good 15.3% |
| Uruguayans | 67.1 /100 | #163 | Good 15.3% |
| Colombians | 66.9 /100 | #164 | Good 15.3% |
| Immigrants | Kenya | 66.6 /100 | #165 | Good 15.3% |
| Swedes | 66.1 /100 | #166 | Good 15.2% |
| Senegalese | 65.6 /100 | #167 | Good 15.2% |
| Immigrants | North Macedonia | 64.5 /100 | #168 | Good 15.2% |
| Scottish | 62.7 /100 | #169 | Good 15.2% |
| Irish | 56.3 /100 | #170 | Average 15.0% |
| Immigrants | Ghana | 53.6 /100 | #171 | Average 15.0% |
| Immigrants | Uruguay | 52.8 /100 | #172 | Average 15.0% |
| Costa Ricans | 52.5 /100 | #173 | Average 15.0% |
Demographics Similar to British West Indians by Master's Degree
In terms of master's degree, the demographic groups most similar to British West Indians are Dutch (13.8%, a difference of 0.030%), White/Caucasian (13.8%, a difference of 0.10%), Immigrants from West Indies (13.9%, a difference of 0.42%), Guyanese (13.7%, a difference of 0.58%), and Immigrants from St. Vincent and the Grenadines (13.9%, a difference of 0.86%).
| Demographics | Rating | Rank | Master's Degree |
| Ecuadorians | 12.6 /100 | #222 | Poor 14.0% |
| Immigrants | South Eastern Asia | 11.9 /100 | #223 | Poor 14.0% |
| Immigrants | Grenada | 11.8 /100 | #224 | Poor 14.0% |
| Portuguese | 11.2 /100 | #225 | Poor 13.9% |
| Immigrants | St. Vincent and the Grenadines | 11.0 /100 | #226 | Poor 13.9% |
| Immigrants | West Indies | 9.8 /100 | #227 | Tragic 13.9% |
| Whites/Caucasians | 9.1 /100 | #228 | Tragic 13.8% |
| British West Indians | 8.8 /100 | #229 | Tragic 13.8% |
| Dutch | 8.7 /100 | #230 | Tragic 13.8% |
| Guyanese | 7.6 /100 | #231 | Tragic 13.7% |
| Immigrants | Philippines | 6.0 /100 | #232 | Tragic 13.6% |
| Immigrants | Ecuador | 5.7 /100 | #233 | Tragic 13.6% |
| Immigrants | Burma/Myanmar | 5.0 /100 | #234 | Tragic 13.5% |
| German Russians | 4.5 /100 | #235 | Tragic 13.5% |
| Immigrants | Guyana | 4.4 /100 | #236 | Tragic 13.4% |