Swedish vs Immigrants from Micronesia Master's Degree
COMPARE
Swedish
Immigrants from Micronesia
Master's Degree
Master's Degree Comparison
Swedes
Immigrants from Micronesia
15.2%
MASTER'S DEGREE
66.1/ 100
METRIC RATING
166th/ 347
METRIC RANK
10.8%
MASTER'S DEGREE
0.0/ 100
METRIC RATING
320th/ 347
METRIC RANK
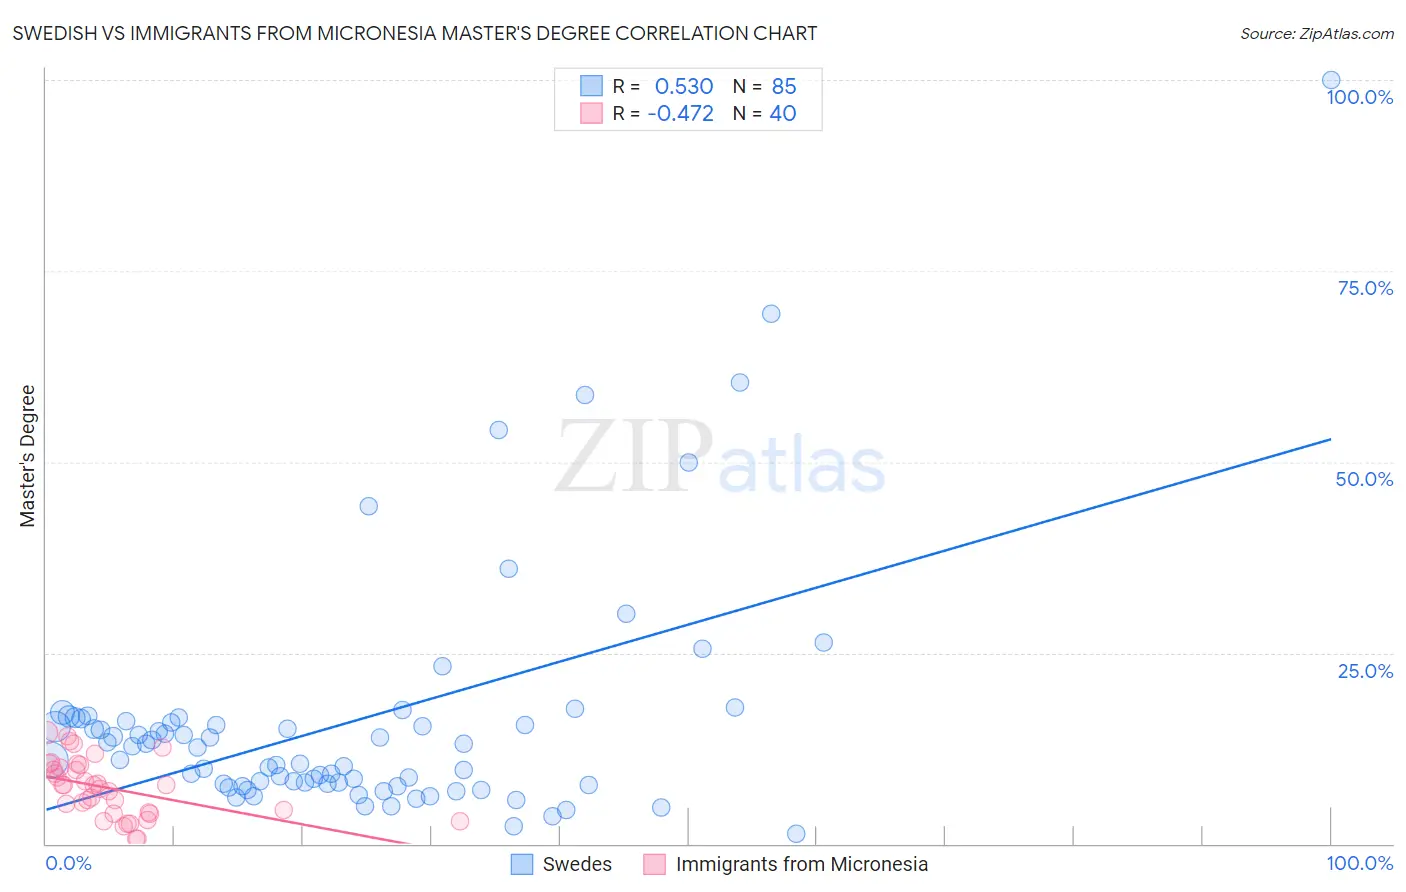
Swedish vs Immigrants from Micronesia Master's Degree Correlation Chart
The statistical analysis conducted on geographies consisting of 538,720,356 people shows a substantial positive correlation between the proportion of Swedes and percentage of population with at least master's degree education in the United States with a correlation coefficient (R) of 0.530 and weighted average of 15.2%. Similarly, the statistical analysis conducted on geographies consisting of 61,602,639 people shows a moderate negative correlation between the proportion of Immigrants from Micronesia and percentage of population with at least master's degree education in the United States with a correlation coefficient (R) of -0.472 and weighted average of 10.8%, a difference of 41.6%.
Master's Degree Correlation Summary
| Measurement | Swedish | Immigrants from Micronesia |
| Minimum | 1.3% | 0.67% |
| Maximum | 100.0% | 14.6% |
| Range | 98.7% | 13.9% |
| Mean | 16.0% | 7.3% |
| Median | 12.6% | 7.7% |
| Interquartile 25% (IQ1) | 7.7% | 4.0% |
| Interquartile 75% (IQ3) | 16.2% | 10.2% |
| Interquartile Range (IQR) | 8.5% | 6.1% |
| Standard Deviation (Sample) | 15.9% | 3.8% |
| Standard Deviation (Population) | 15.8% | 3.7% |
Similar Demographics by Master's Degree
Demographics Similar to Swedes by Master's Degree
In terms of master's degree, the demographic groups most similar to Swedes are Immigrants from Kenya (15.3%, a difference of 0.070%), Senegalese (15.2%, a difference of 0.070%), Colombian (15.3%, a difference of 0.11%), Uruguayan (15.3%, a difference of 0.14%), and Immigrants from North Macedonia (15.2%, a difference of 0.22%).
| Demographics | Rating | Rank | Master's Degree |
| Luxembourgers | 71.0 /100 | #159 | Good 15.3% |
| Kenyans | 70.3 /100 | #160 | Good 15.3% |
| Sudanese | 68.7 /100 | #161 | Good 15.3% |
| Peruvians | 68.7 /100 | #162 | Good 15.3% |
| Uruguayans | 67.1 /100 | #163 | Good 15.3% |
| Colombians | 66.9 /100 | #164 | Good 15.3% |
| Immigrants | Kenya | 66.6 /100 | #165 | Good 15.3% |
| Swedes | 66.1 /100 | #166 | Good 15.2% |
| Senegalese | 65.6 /100 | #167 | Good 15.2% |
| Immigrants | North Macedonia | 64.5 /100 | #168 | Good 15.2% |
| Scottish | 62.7 /100 | #169 | Good 15.2% |
| Irish | 56.3 /100 | #170 | Average 15.0% |
| Immigrants | Ghana | 53.6 /100 | #171 | Average 15.0% |
| Immigrants | Uruguay | 52.8 /100 | #172 | Average 15.0% |
| Costa Ricans | 52.5 /100 | #173 | Average 15.0% |
Demographics Similar to Immigrants from Micronesia by Master's Degree
In terms of master's degree, the demographic groups most similar to Immigrants from Micronesia are Pennsylvania German (10.7%, a difference of 0.21%), Kiowa (10.8%, a difference of 0.62%), Sioux (10.7%, a difference of 0.85%), Immigrants from Cuba (10.9%, a difference of 0.86%), and Hopi (10.9%, a difference of 0.99%).
| Demographics | Rating | Rank | Master's Degree |
| Yaqui | 0.0 /100 | #313 | Tragic 11.0% |
| Cajuns | 0.0 /100 | #314 | Tragic 11.0% |
| Apache | 0.0 /100 | #315 | Tragic 11.0% |
| Hispanics or Latinos | 0.0 /100 | #316 | Tragic 10.9% |
| Hopi | 0.0 /100 | #317 | Tragic 10.9% |
| Immigrants | Cuba | 0.0 /100 | #318 | Tragic 10.9% |
| Kiowa | 0.0 /100 | #319 | Tragic 10.8% |
| Immigrants | Micronesia | 0.0 /100 | #320 | Tragic 10.8% |
| Pennsylvania Germans | 0.0 /100 | #321 | Tragic 10.7% |
| Sioux | 0.0 /100 | #322 | Tragic 10.7% |
| Crow | 0.0 /100 | #323 | Tragic 10.6% |
| Dutch West Indians | 0.0 /100 | #324 | Tragic 10.6% |
| Inupiat | 0.0 /100 | #325 | Tragic 10.5% |
| Creek | 0.0 /100 | #326 | Tragic 10.5% |
| Paiute | 0.0 /100 | #327 | Tragic 10.5% |