Afghan vs British West Indian Master's Degree
COMPARE
Afghan
British West Indian
Master's Degree
Master's Degree Comparison
Afghans
British West Indians
16.5%
MASTER'S DEGREE
96.2/ 100
METRIC RATING
121st/ 347
METRIC RANK
13.8%
MASTER'S DEGREE
8.8/ 100
METRIC RATING
229th/ 347
METRIC RANK
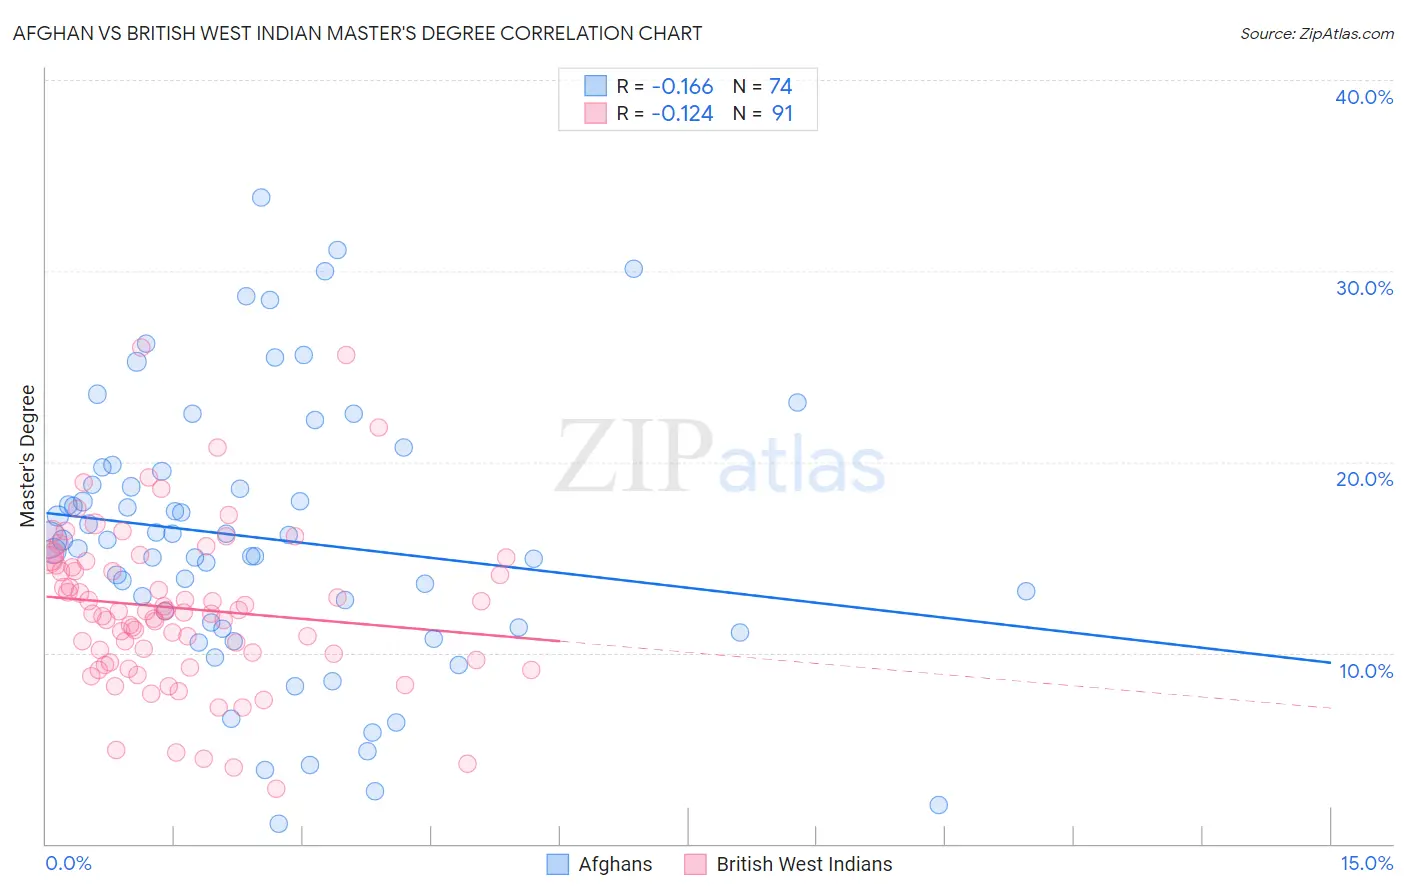
Afghan vs British West Indian Master's Degree Correlation Chart
The statistical analysis conducted on geographies consisting of 148,857,027 people shows a poor negative correlation between the proportion of Afghans and percentage of population with at least master's degree education in the United States with a correlation coefficient (R) of -0.166 and weighted average of 16.5%. Similarly, the statistical analysis conducted on geographies consisting of 152,656,458 people shows a poor negative correlation between the proportion of British West Indians and percentage of population with at least master's degree education in the United States with a correlation coefficient (R) of -0.124 and weighted average of 13.8%, a difference of 19.2%.
Master's Degree Correlation Summary
| Measurement | Afghan | British West Indian |
| Minimum | 1.0% | 2.9% |
| Maximum | 33.8% | 26.0% |
| Range | 32.8% | 23.1% |
| Mean | 16.0% | 12.3% |
| Median | 15.9% | 12.2% |
| Interquartile 25% (IQ1) | 11.3% | 9.6% |
| Interquartile 75% (IQ3) | 19.5% | 14.8% |
| Interquartile Range (IQR) | 8.2% | 5.2% |
| Standard Deviation (Sample) | 7.1% | 4.2% |
| Standard Deviation (Population) | 7.1% | 4.2% |
Similar Demographics by Master's Degree
Demographics Similar to Afghans by Master's Degree
In terms of master's degree, the demographic groups most similar to Afghans are Lebanese (16.5%, a difference of 0.20%), Jordanian (16.5%, a difference of 0.30%), British (16.4%, a difference of 0.43%), Croatian (16.4%, a difference of 0.44%), and Immigrants from Eritrea (16.4%, a difference of 0.52%).
| Demographics | Rating | Rank | Master's Degree |
| Northern Europeans | 97.6 /100 | #114 | Exceptional 16.7% |
| Immigrants | Uganda | 97.3 /100 | #115 | Exceptional 16.6% |
| Immigrants | Southern Europe | 97.2 /100 | #116 | Exceptional 16.6% |
| Immigrants | Moldova | 97.2 /100 | #117 | Exceptional 16.6% |
| Brazilians | 96.8 /100 | #118 | Exceptional 16.5% |
| Jordanians | 96.5 /100 | #119 | Exceptional 16.5% |
| Lebanese | 96.4 /100 | #120 | Exceptional 16.5% |
| Afghans | 96.2 /100 | #121 | Exceptional 16.5% |
| British | 95.6 /100 | #122 | Exceptional 16.4% |
| Croatians | 95.6 /100 | #123 | Exceptional 16.4% |
| Immigrants | Eritrea | 95.5 /100 | #124 | Exceptional 16.4% |
| Italians | 95.4 /100 | #125 | Exceptional 16.4% |
| Immigrants | Eastern Africa | 95.2 /100 | #126 | Exceptional 16.3% |
| Palestinians | 94.8 /100 | #127 | Exceptional 16.3% |
| Immigrants | Sierra Leone | 94.7 /100 | #128 | Exceptional 16.3% |
Demographics Similar to British West Indians by Master's Degree
In terms of master's degree, the demographic groups most similar to British West Indians are Dutch (13.8%, a difference of 0.030%), White/Caucasian (13.8%, a difference of 0.10%), Immigrants from West Indies (13.9%, a difference of 0.42%), Guyanese (13.7%, a difference of 0.58%), and Immigrants from St. Vincent and the Grenadines (13.9%, a difference of 0.86%).
| Demographics | Rating | Rank | Master's Degree |
| Ecuadorians | 12.6 /100 | #222 | Poor 14.0% |
| Immigrants | South Eastern Asia | 11.9 /100 | #223 | Poor 14.0% |
| Immigrants | Grenada | 11.8 /100 | #224 | Poor 14.0% |
| Portuguese | 11.2 /100 | #225 | Poor 13.9% |
| Immigrants | St. Vincent and the Grenadines | 11.0 /100 | #226 | Poor 13.9% |
| Immigrants | West Indies | 9.8 /100 | #227 | Tragic 13.9% |
| Whites/Caucasians | 9.1 /100 | #228 | Tragic 13.8% |
| British West Indians | 8.8 /100 | #229 | Tragic 13.8% |
| Dutch | 8.7 /100 | #230 | Tragic 13.8% |
| Guyanese | 7.6 /100 | #231 | Tragic 13.7% |
| Immigrants | Philippines | 6.0 /100 | #232 | Tragic 13.6% |
| Immigrants | Ecuador | 5.7 /100 | #233 | Tragic 13.6% |
| Immigrants | Burma/Myanmar | 5.0 /100 | #234 | Tragic 13.5% |
| German Russians | 4.5 /100 | #235 | Tragic 13.5% |
| Immigrants | Guyana | 4.4 /100 | #236 | Tragic 13.4% |