Swedish vs British West Indian Seniors Poverty Over the Age of 65
COMPARE
Swedish
British West Indian
Seniors Poverty Over the Age of 65
Seniors Poverty Over the Age of 65 Comparison
Swedes
British West Indians
8.7%
SENIORS POVERTY OVER THE AGE OF 65
100.0/ 100
METRIC RATING
4th/ 347
METRIC RANK
15.6%
SENIORS POVERTY OVER THE AGE OF 65
0.0/ 100
METRIC RATING
331st/ 347
METRIC RANK
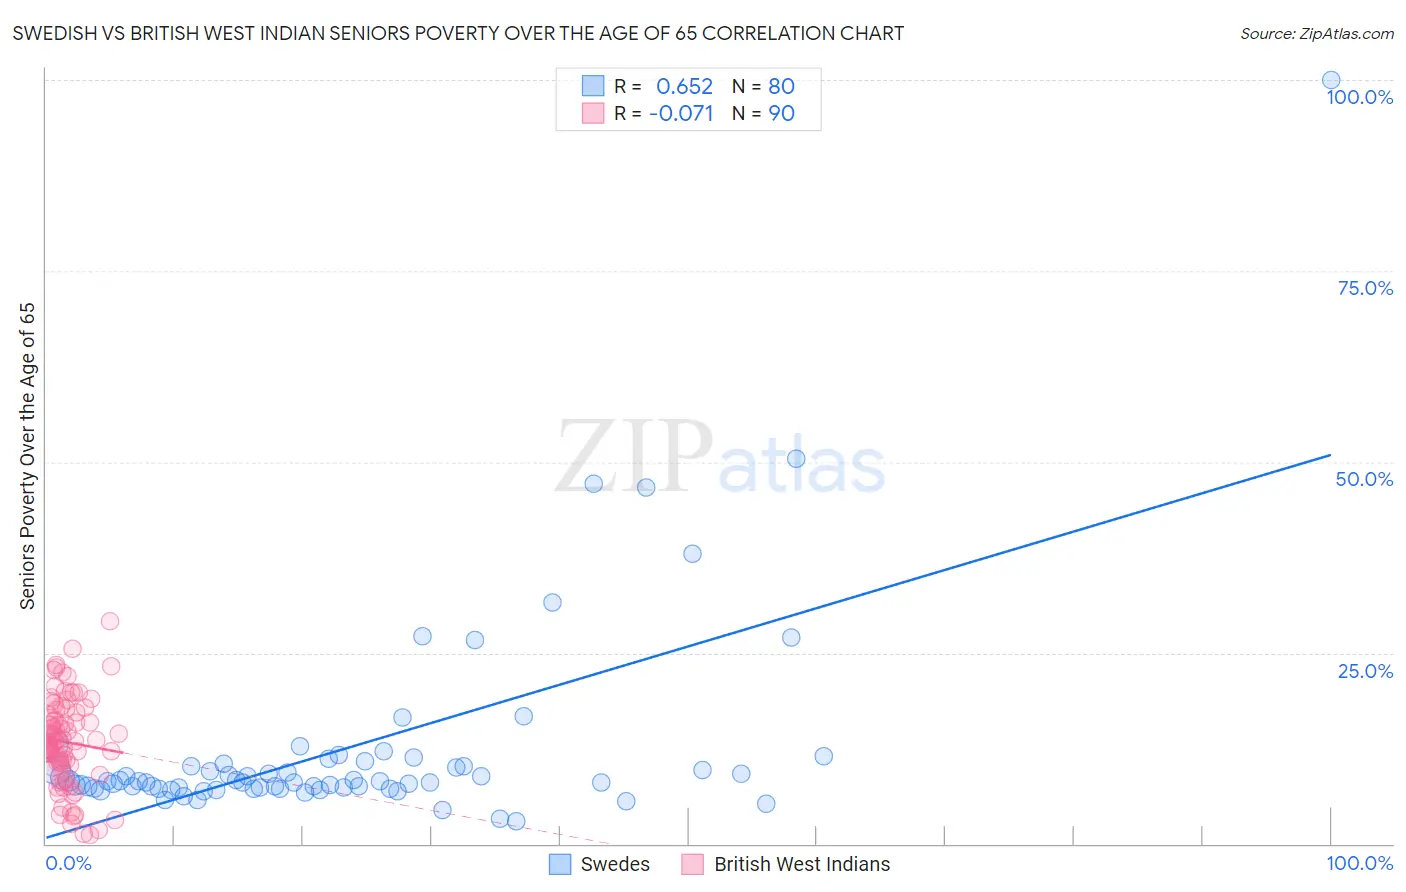
Swedish vs British West Indian Seniors Poverty Over the Age of 65 Correlation Chart
The statistical analysis conducted on geographies consisting of 534,843,881 people shows a significant positive correlation between the proportion of Swedes and poverty level among seniors over the age of 65 in the United States with a correlation coefficient (R) of 0.652 and weighted average of 8.7%. Similarly, the statistical analysis conducted on geographies consisting of 152,431,977 people shows a slight negative correlation between the proportion of British West Indians and poverty level among seniors over the age of 65 in the United States with a correlation coefficient (R) of -0.071 and weighted average of 15.6%, a difference of 78.5%.
Seniors Poverty Over the Age of 65 Correlation Summary
| Measurement | Swedish | British West Indian |
| Minimum | 2.9% | 1.2% |
| Maximum | 100.0% | 29.2% |
| Range | 97.1% | 28.0% |
| Mean | 12.4% | 13.3% |
| Median | 8.2% | 13.3% |
| Interquartile 25% (IQ1) | 7.3% | 10.3% |
| Interquartile 75% (IQ3) | 10.3% | 17.3% |
| Interquartile Range (IQR) | 3.1% | 6.9% |
| Standard Deviation (Sample) | 13.6% | 5.8% |
| Standard Deviation (Population) | 13.5% | 5.8% |
Similar Demographics by Seniors Poverty Over the Age of 65
Demographics Similar to Swedes by Seniors Poverty Over the Age of 65
In terms of seniors poverty over the age of 65, the demographic groups most similar to Swedes are Immigrants from India (8.8%, a difference of 0.36%), Norwegian (8.7%, a difference of 0.60%), Danish (8.8%, a difference of 0.81%), German (9.0%, a difference of 2.4%), and Czech (9.0%, a difference of 3.0%).
| Demographics | Rating | Rank | Seniors Poverty Over the Age of 65 |
| Chinese | 100.0 /100 | #1 | Exceptional 8.3% |
| Tlingit-Haida | 100.0 /100 | #2 | Exceptional 8.3% |
| Norwegians | 100.0 /100 | #3 | Exceptional 8.7% |
| Swedes | 100.0 /100 | #4 | Exceptional 8.7% |
| Immigrants | India | 100.0 /100 | #5 | Exceptional 8.8% |
| Danes | 100.0 /100 | #6 | Exceptional 8.8% |
| Germans | 100.0 /100 | #7 | Exceptional 9.0% |
| Czechs | 100.0 /100 | #8 | Exceptional 9.0% |
| English | 100.0 /100 | #9 | Exceptional 9.1% |
| Lithuanians | 100.0 /100 | #10 | Exceptional 9.1% |
| Maltese | 99.9 /100 | #11 | Exceptional 9.1% |
| Scandinavians | 99.9 /100 | #12 | Exceptional 9.1% |
| Croatians | 99.9 /100 | #13 | Exceptional 9.1% |
| Poles | 99.9 /100 | #14 | Exceptional 9.1% |
| Dutch | 99.9 /100 | #15 | Exceptional 9.1% |
Demographics Similar to British West Indians by Seniors Poverty Over the Age of 65
In terms of seniors poverty over the age of 65, the demographic groups most similar to British West Indians are Immigrants from St. Vincent and the Grenadines (15.5%, a difference of 0.51%), Immigrants from Dominica (15.5%, a difference of 0.81%), Immigrants from Grenada (15.8%, a difference of 1.4%), Immigrants from Yemen (15.9%, a difference of 1.8%), and Sioux (15.3%, a difference of 1.9%).
| Demographics | Rating | Rank | Seniors Poverty Over the Age of 65 |
| Nicaraguans | 0.0 /100 | #324 | Tragic 15.0% |
| Central American Indians | 0.0 /100 | #325 | Tragic 15.1% |
| Immigrants | Armenia | 0.0 /100 | #326 | Tragic 15.2% |
| Crow | 0.0 /100 | #327 | Tragic 15.2% |
| Sioux | 0.0 /100 | #328 | Tragic 15.3% |
| Immigrants | Dominica | 0.0 /100 | #329 | Tragic 15.5% |
| Immigrants | St. Vincent and the Grenadines | 0.0 /100 | #330 | Tragic 15.5% |
| British West Indians | 0.0 /100 | #331 | Tragic 15.6% |
| Immigrants | Grenada | 0.0 /100 | #332 | Tragic 15.8% |
| Immigrants | Yemen | 0.0 /100 | #333 | Tragic 15.9% |
| Immigrants | Nicaragua | 0.0 /100 | #334 | Tragic 15.9% |
| Cubans | 0.0 /100 | #335 | Tragic 16.1% |
| Immigrants | Cabo Verde | 0.0 /100 | #336 | Tragic 16.2% |
| Immigrants | Caribbean | 0.0 /100 | #337 | Tragic 16.5% |
| Pueblo | 0.0 /100 | #338 | Tragic 17.2% |