Swedish vs Immigrants from Serbia Master's Degree
COMPARE
Swedish
Immigrants from Serbia
Master's Degree
Master's Degree Comparison
Swedes
Immigrants from Serbia
15.2%
MASTER'S DEGREE
66.1/ 100
METRIC RATING
166th/ 347
METRIC RANK
18.5%
MASTER'S DEGREE
99.9/ 100
METRIC RATING
55th/ 347
METRIC RANK
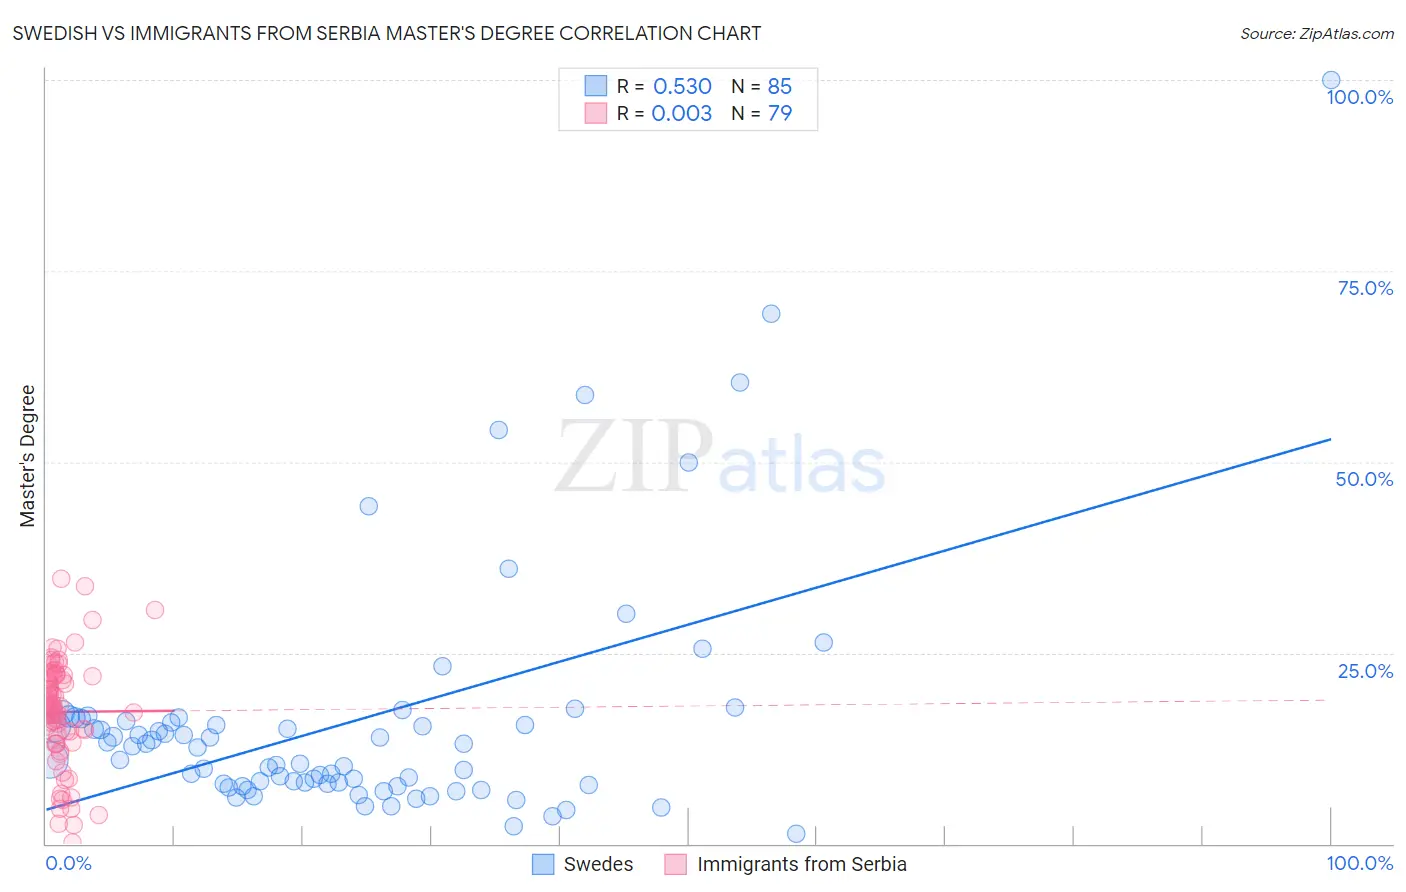
Swedish vs Immigrants from Serbia Master's Degree Correlation Chart
The statistical analysis conducted on geographies consisting of 538,720,356 people shows a substantial positive correlation between the proportion of Swedes and percentage of population with at least master's degree education in the United States with a correlation coefficient (R) of 0.530 and weighted average of 15.2%. Similarly, the statistical analysis conducted on geographies consisting of 131,731,006 people shows no correlation between the proportion of Immigrants from Serbia and percentage of population with at least master's degree education in the United States with a correlation coefficient (R) of 0.003 and weighted average of 18.5%, a difference of 21.3%.
Master's Degree Correlation Summary
| Measurement | Swedish | Immigrants from Serbia |
| Minimum | 1.3% | 0.15% |
| Maximum | 100.0% | 34.6% |
| Range | 98.7% | 34.5% |
| Mean | 16.0% | 17.3% |
| Median | 12.6% | 17.9% |
| Interquartile 25% (IQ1) | 7.7% | 13.2% |
| Interquartile 75% (IQ3) | 16.2% | 22.0% |
| Interquartile Range (IQR) | 8.5% | 8.7% |
| Standard Deviation (Sample) | 15.9% | 7.1% |
| Standard Deviation (Population) | 15.8% | 7.0% |
Similar Demographics by Master's Degree
Demographics Similar to Swedes by Master's Degree
In terms of master's degree, the demographic groups most similar to Swedes are Immigrants from Kenya (15.3%, a difference of 0.070%), Senegalese (15.2%, a difference of 0.070%), Colombian (15.3%, a difference of 0.11%), Uruguayan (15.3%, a difference of 0.14%), and Immigrants from North Macedonia (15.2%, a difference of 0.22%).
| Demographics | Rating | Rank | Master's Degree |
| Luxembourgers | 71.0 /100 | #159 | Good 15.3% |
| Kenyans | 70.3 /100 | #160 | Good 15.3% |
| Sudanese | 68.7 /100 | #161 | Good 15.3% |
| Peruvians | 68.7 /100 | #162 | Good 15.3% |
| Uruguayans | 67.1 /100 | #163 | Good 15.3% |
| Colombians | 66.9 /100 | #164 | Good 15.3% |
| Immigrants | Kenya | 66.6 /100 | #165 | Good 15.3% |
| Swedes | 66.1 /100 | #166 | Good 15.2% |
| Senegalese | 65.6 /100 | #167 | Good 15.2% |
| Immigrants | North Macedonia | 64.5 /100 | #168 | Good 15.2% |
| Scottish | 62.7 /100 | #169 | Good 15.2% |
| Irish | 56.3 /100 | #170 | Average 15.0% |
| Immigrants | Ghana | 53.6 /100 | #171 | Average 15.0% |
| Immigrants | Uruguay | 52.8 /100 | #172 | Average 15.0% |
| Costa Ricans | 52.5 /100 | #173 | Average 15.0% |
Demographics Similar to Immigrants from Serbia by Master's Degree
In terms of master's degree, the demographic groups most similar to Immigrants from Serbia are Immigrants from Lithuania (18.5%, a difference of 0.030%), Asian (18.4%, a difference of 0.22%), Immigrants from Czechoslovakia (18.5%, a difference of 0.34%), Immigrants from Asia (18.4%, a difference of 0.36%), and Immigrants from Kuwait (18.6%, a difference of 0.42%).
| Demographics | Rating | Rank | Master's Degree |
| Paraguayans | 100.0 /100 | #48 | Exceptional 18.8% |
| Estonians | 100.0 /100 | #49 | Exceptional 18.8% |
| Bulgarians | 100.0 /100 | #50 | Exceptional 18.8% |
| Immigrants | South Africa | 100.0 /100 | #51 | Exceptional 18.8% |
| Immigrants | Kuwait | 100.0 /100 | #52 | Exceptional 18.6% |
| Immigrants | Czechoslovakia | 99.9 /100 | #53 | Exceptional 18.5% |
| Immigrants | Lithuania | 99.9 /100 | #54 | Exceptional 18.5% |
| Immigrants | Serbia | 99.9 /100 | #55 | Exceptional 18.5% |
| Asians | 99.9 /100 | #56 | Exceptional 18.4% |
| Immigrants | Asia | 99.9 /100 | #57 | Exceptional 18.4% |
| Australians | 99.9 /100 | #58 | Exceptional 18.4% |
| Immigrants | Bulgaria | 99.9 /100 | #59 | Exceptional 18.3% |
| New Zealanders | 99.9 /100 | #60 | Exceptional 18.3% |
| Immigrants | Europe | 99.9 /100 | #61 | Exceptional 18.2% |
| Argentineans | 99.9 /100 | #62 | Exceptional 18.2% |