Swedish vs British West Indian No Vehicles in Household
COMPARE
Swedish
British West Indian
No Vehicles in Household
No Vehicles in Household Comparison
Swedes
British West Indians
6.8%
NO VEHICLES IN HOUSEHOLD
100.0/ 100
METRIC RATING
8th/ 347
METRIC RANK
29.7%
NO VEHICLES IN HOUSEHOLD
0.0/ 100
METRIC RATING
342nd/ 347
METRIC RANK
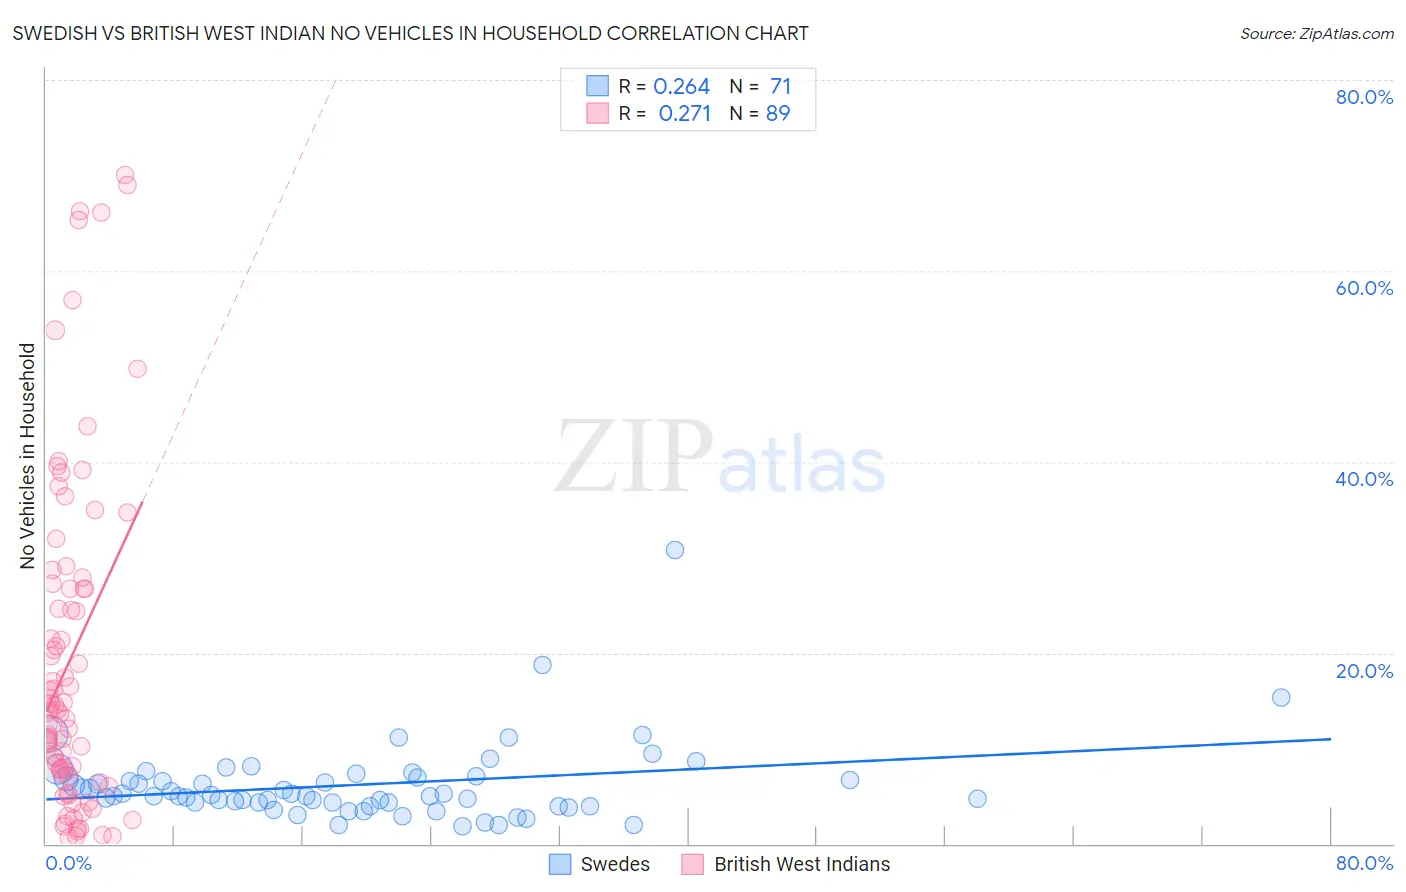
Swedish vs British West Indian No Vehicles in Household Correlation Chart
The statistical analysis conducted on geographies consisting of 534,930,678 people shows a weak positive correlation between the proportion of Swedes and percentage of households with no vehicle available in the United States with a correlation coefficient (R) of 0.264 and weighted average of 6.8%. Similarly, the statistical analysis conducted on geographies consisting of 152,511,245 people shows a weak positive correlation between the proportion of British West Indians and percentage of households with no vehicle available in the United States with a correlation coefficient (R) of 0.271 and weighted average of 29.7%, a difference of 337.7%.
No Vehicles in Household Correlation Summary
| Measurement | Swedish | British West Indian |
| Minimum | 1.8% | 0.70% |
| Maximum | 30.8% | 70.0% |
| Range | 28.9% | 69.3% |
| Mean | 6.2% | 19.4% |
| Median | 5.0% | 14.1% |
| Interquartile 25% (IQ1) | 4.3% | 7.2% |
| Interquartile 75% (IQ3) | 6.9% | 27.0% |
| Interquartile Range (IQR) | 2.6% | 19.9% |
| Standard Deviation (Sample) | 4.2% | 17.5% |
| Standard Deviation (Population) | 4.2% | 17.4% |
Similar Demographics by No Vehicles in Household
Demographics Similar to Swedes by No Vehicles in Household
In terms of no vehicles in household, the demographic groups most similar to Swedes are Scotch-Irish (6.8%, a difference of 0.21%), Scottish (6.8%, a difference of 0.47%), Dutch (6.8%, a difference of 0.72%), Czech (6.9%, a difference of 1.3%), and German (6.7%, a difference of 1.8%).
| Demographics | Rating | Rank | No Vehicles in Household |
| Luxembourgers | 100.0 /100 | #1 | Exceptional 5.4% |
| Norwegians | 100.0 /100 | #2 | Exceptional 6.4% |
| English | 100.0 /100 | #3 | Exceptional 6.5% |
| Danes | 100.0 /100 | #4 | Exceptional 6.6% |
| Yakama | 100.0 /100 | #5 | Exceptional 6.6% |
| Germans | 100.0 /100 | #6 | Exceptional 6.7% |
| Scottish | 100.0 /100 | #7 | Exceptional 6.8% |
| Swedes | 100.0 /100 | #8 | Exceptional 6.8% |
| Scotch-Irish | 100.0 /100 | #9 | Exceptional 6.8% |
| Dutch | 100.0 /100 | #10 | Exceptional 6.8% |
| Czechs | 100.0 /100 | #11 | Exceptional 6.9% |
| Assyrians/Chaldeans/Syriacs | 100.0 /100 | #12 | Exceptional 7.0% |
| Scandinavians | 100.0 /100 | #13 | Exceptional 7.0% |
| Mexicans | 100.0 /100 | #14 | Exceptional 7.0% |
| Whites/Caucasians | 100.0 /100 | #15 | Exceptional 7.0% |
Demographics Similar to British West Indians by No Vehicles in Household
In terms of no vehicles in household, the demographic groups most similar to British West Indians are Inupiat (29.9%, a difference of 0.41%), Immigrants from Guyana (29.5%, a difference of 0.85%), Immigrants from Barbados (29.5%, a difference of 0.90%), Dominican (29.4%, a difference of 1.1%), and Guyanese (29.3%, a difference of 1.5%).
| Demographics | Rating | Rank | No Vehicles in Household |
| Immigrants | Trinidad and Tobago | 0.0 /100 | #333 | Tragic 24.6% |
| Immigrants | Bangladesh | 0.0 /100 | #334 | Tragic 25.8% |
| Barbadians | 0.0 /100 | #335 | Tragic 26.1% |
| Vietnamese | 0.0 /100 | #336 | Tragic 26.2% |
| Immigrants | Uzbekistan | 0.0 /100 | #337 | Tragic 26.7% |
| Guyanese | 0.0 /100 | #338 | Tragic 29.3% |
| Dominicans | 0.0 /100 | #339 | Tragic 29.4% |
| Immigrants | Barbados | 0.0 /100 | #340 | Tragic 29.5% |
| Immigrants | Guyana | 0.0 /100 | #341 | Tragic 29.5% |
| British West Indians | 0.0 /100 | #342 | Tragic 29.7% |
| Inupiat | 0.0 /100 | #343 | Tragic 29.9% |
| Immigrants | Dominican Republic | 0.0 /100 | #344 | Tragic 31.4% |
| Immigrants | St. Vincent and the Grenadines | 0.0 /100 | #345 | Tragic 35.4% |
| Immigrants | Grenada | 0.0 /100 | #346 | Tragic 37.5% |
| Yup'ik | 0.0 /100 | #347 | Tragic 45.9% |