Barbadian vs British West Indian Master's Degree
COMPARE
Barbadian
British West Indian
Master's Degree
Master's Degree Comparison
Barbadians
British West Indians
14.7%
MASTER'S DEGREE
38.3/ 100
METRIC RATING
185th/ 347
METRIC RANK
13.8%
MASTER'S DEGREE
8.8/ 100
METRIC RATING
229th/ 347
METRIC RANK
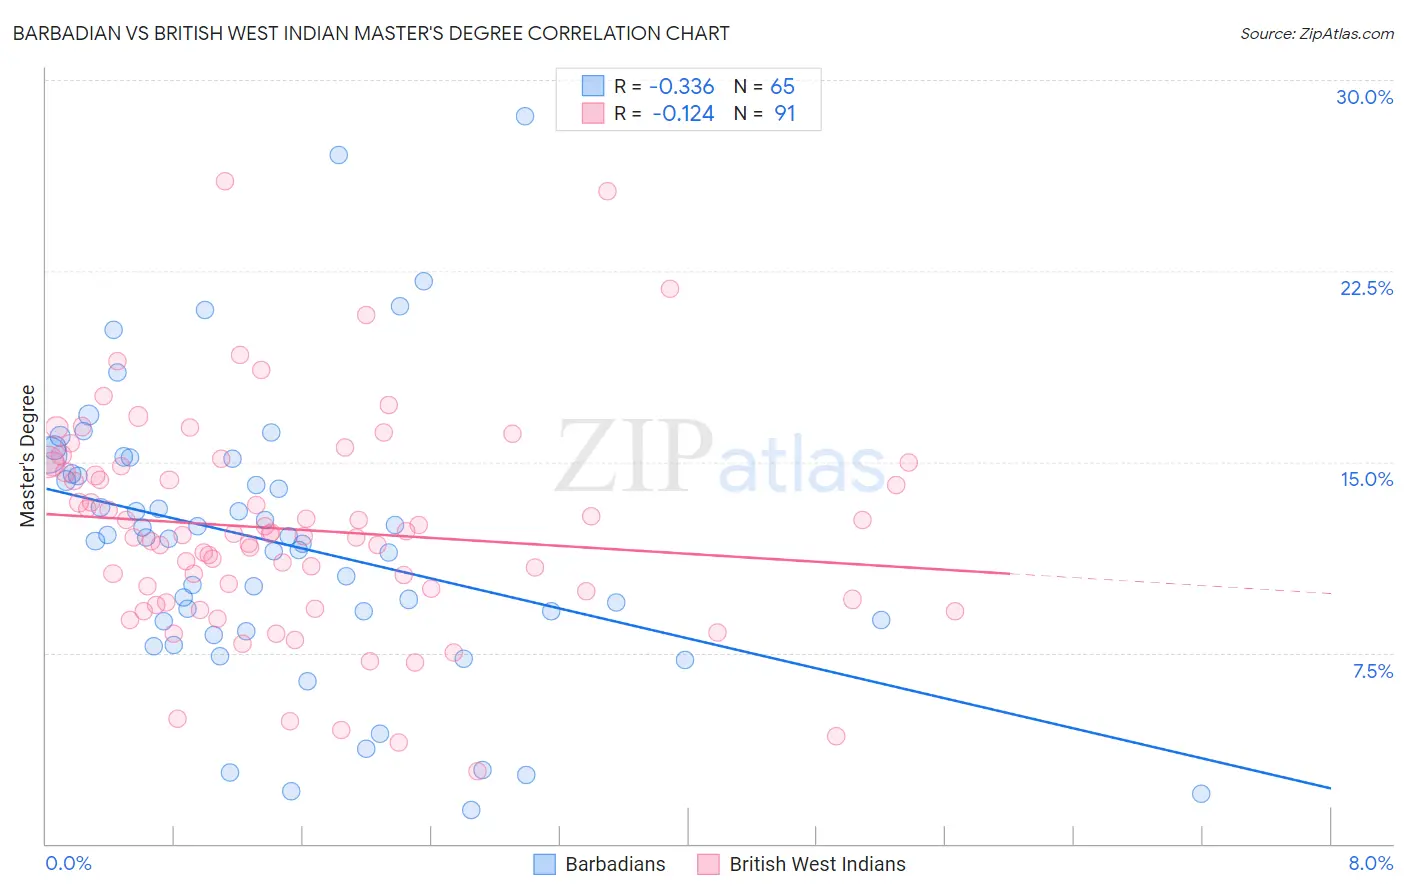
Barbadian vs British West Indian Master's Degree Correlation Chart
The statistical analysis conducted on geographies consisting of 141,295,257 people shows a mild negative correlation between the proportion of Barbadians and percentage of population with at least master's degree education in the United States with a correlation coefficient (R) of -0.336 and weighted average of 14.7%. Similarly, the statistical analysis conducted on geographies consisting of 152,656,458 people shows a poor negative correlation between the proportion of British West Indians and percentage of population with at least master's degree education in the United States with a correlation coefficient (R) of -0.124 and weighted average of 13.8%, a difference of 6.4%.
Master's Degree Correlation Summary
| Measurement | Barbadian | British West Indian |
| Minimum | 1.3% | 2.9% |
| Maximum | 28.6% | 26.0% |
| Range | 27.2% | 23.1% |
| Mean | 11.8% | 12.3% |
| Median | 12.0% | 12.2% |
| Interquartile 25% (IQ1) | 8.6% | 9.6% |
| Interquartile 75% (IQ3) | 14.8% | 14.8% |
| Interquartile Range (IQR) | 6.3% | 5.2% |
| Standard Deviation (Sample) | 5.5% | 4.2% |
| Standard Deviation (Population) | 5.5% | 4.2% |
Similar Demographics by Master's Degree
Demographics Similar to Barbadians by Master's Degree
In terms of master's degree, the demographic groups most similar to Barbadians are Immigrants from Zaire (14.7%, a difference of 0.16%), Immigrants from Oceania (14.7%, a difference of 0.16%), Sri Lankan (14.7%, a difference of 0.18%), Basque (14.7%, a difference of 0.24%), and Czech (14.7%, a difference of 0.28%).
| Demographics | Rating | Rank | Master's Degree |
| English | 45.0 /100 | #178 | Average 14.8% |
| Immigrants | Iraq | 41.3 /100 | #179 | Average 14.8% |
| Celtics | 41.3 /100 | #180 | Average 14.8% |
| Swiss | 41.1 /100 | #181 | Average 14.7% |
| Czechs | 40.4 /100 | #182 | Average 14.7% |
| Sri Lankans | 39.6 /100 | #183 | Fair 14.7% |
| Immigrants | Zaire | 39.5 /100 | #184 | Fair 14.7% |
| Barbadians | 38.3 /100 | #185 | Fair 14.7% |
| Immigrants | Oceania | 37.1 /100 | #186 | Fair 14.7% |
| Basques | 36.5 /100 | #187 | Fair 14.7% |
| Immigrants | Costa Rica | 36.2 /100 | #188 | Fair 14.7% |
| Immigrants | Immigrants | 36.0 /100 | #189 | Fair 14.6% |
| Spaniards | 35.8 /100 | #190 | Fair 14.6% |
| Welsh | 34.2 /100 | #191 | Fair 14.6% |
| Immigrants | Middle Africa | 33.6 /100 | #192 | Fair 14.6% |
Demographics Similar to British West Indians by Master's Degree
In terms of master's degree, the demographic groups most similar to British West Indians are Dutch (13.8%, a difference of 0.030%), White/Caucasian (13.8%, a difference of 0.10%), Immigrants from West Indies (13.9%, a difference of 0.42%), Guyanese (13.7%, a difference of 0.58%), and Immigrants from St. Vincent and the Grenadines (13.9%, a difference of 0.86%).
| Demographics | Rating | Rank | Master's Degree |
| Ecuadorians | 12.6 /100 | #222 | Poor 14.0% |
| Immigrants | South Eastern Asia | 11.9 /100 | #223 | Poor 14.0% |
| Immigrants | Grenada | 11.8 /100 | #224 | Poor 14.0% |
| Portuguese | 11.2 /100 | #225 | Poor 13.9% |
| Immigrants | St. Vincent and the Grenadines | 11.0 /100 | #226 | Poor 13.9% |
| Immigrants | West Indies | 9.8 /100 | #227 | Tragic 13.9% |
| Whites/Caucasians | 9.1 /100 | #228 | Tragic 13.8% |
| British West Indians | 8.8 /100 | #229 | Tragic 13.8% |
| Dutch | 8.7 /100 | #230 | Tragic 13.8% |
| Guyanese | 7.6 /100 | #231 | Tragic 13.7% |
| Immigrants | Philippines | 6.0 /100 | #232 | Tragic 13.6% |
| Immigrants | Ecuador | 5.7 /100 | #233 | Tragic 13.6% |
| Immigrants | Burma/Myanmar | 5.0 /100 | #234 | Tragic 13.5% |
| German Russians | 4.5 /100 | #235 | Tragic 13.5% |
| Immigrants | Guyana | 4.4 /100 | #236 | Tragic 13.4% |