Swedish vs Finnish Master's Degree
COMPARE
Swedish
Finnish
Master's Degree
Master's Degree Comparison
Swedes
Finns
15.2%
MASTER'S DEGREE
66.1/ 100
METRIC RATING
166th/ 347
METRIC RANK
14.2%
MASTER'S DEGREE
16.9/ 100
METRIC RATING
214th/ 347
METRIC RANK
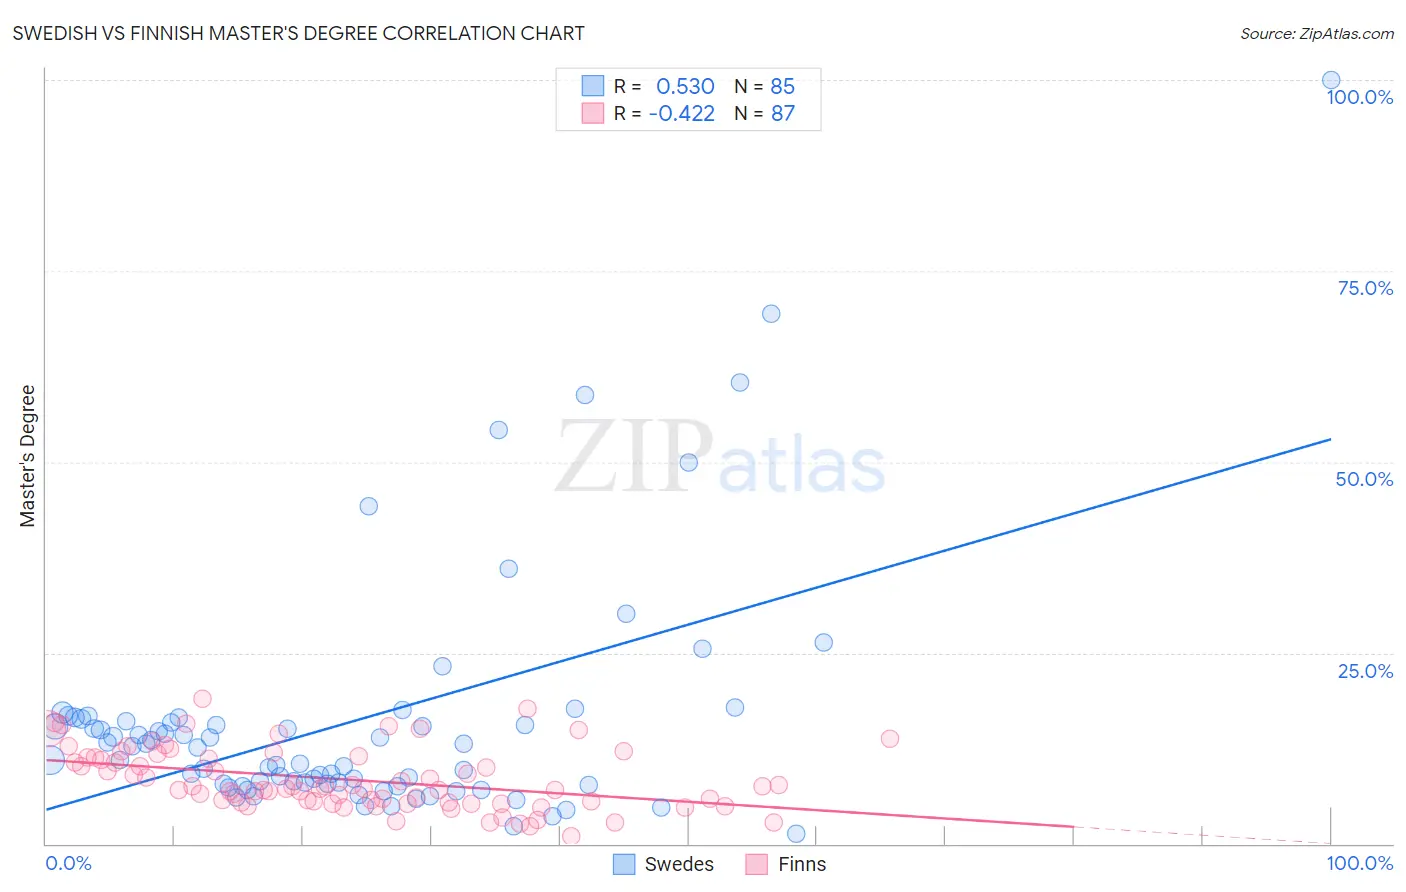
Swedish vs Finnish Master's Degree Correlation Chart
The statistical analysis conducted on geographies consisting of 538,720,356 people shows a substantial positive correlation between the proportion of Swedes and percentage of population with at least master's degree education in the United States with a correlation coefficient (R) of 0.530 and weighted average of 15.2%. Similarly, the statistical analysis conducted on geographies consisting of 404,580,183 people shows a moderate negative correlation between the proportion of Finns and percentage of population with at least master's degree education in the United States with a correlation coefficient (R) of -0.422 and weighted average of 14.2%, a difference of 7.6%.
Master's Degree Correlation Summary
| Measurement | Swedish | Finnish |
| Minimum | 1.3% | 1.0% |
| Maximum | 100.0% | 18.9% |
| Range | 98.7% | 17.9% |
| Mean | 16.0% | 8.4% |
| Median | 12.6% | 7.3% |
| Interquartile 25% (IQ1) | 7.7% | 5.4% |
| Interquartile 75% (IQ3) | 16.2% | 11.3% |
| Interquartile Range (IQR) | 8.5% | 5.8% |
| Standard Deviation (Sample) | 15.9% | 4.0% |
| Standard Deviation (Population) | 15.8% | 4.0% |
Similar Demographics by Master's Degree
Demographics Similar to Swedes by Master's Degree
In terms of master's degree, the demographic groups most similar to Swedes are Immigrants from Kenya (15.3%, a difference of 0.070%), Senegalese (15.2%, a difference of 0.070%), Colombian (15.3%, a difference of 0.11%), Uruguayan (15.3%, a difference of 0.14%), and Immigrants from North Macedonia (15.2%, a difference of 0.22%).
| Demographics | Rating | Rank | Master's Degree |
| Luxembourgers | 71.0 /100 | #159 | Good 15.3% |
| Kenyans | 70.3 /100 | #160 | Good 15.3% |
| Sudanese | 68.7 /100 | #161 | Good 15.3% |
| Peruvians | 68.7 /100 | #162 | Good 15.3% |
| Uruguayans | 67.1 /100 | #163 | Good 15.3% |
| Colombians | 66.9 /100 | #164 | Good 15.3% |
| Immigrants | Kenya | 66.6 /100 | #165 | Good 15.3% |
| Swedes | 66.1 /100 | #166 | Good 15.2% |
| Senegalese | 65.6 /100 | #167 | Good 15.2% |
| Immigrants | North Macedonia | 64.5 /100 | #168 | Good 15.2% |
| Scottish | 62.7 /100 | #169 | Good 15.2% |
| Irish | 56.3 /100 | #170 | Average 15.0% |
| Immigrants | Ghana | 53.6 /100 | #171 | Average 15.0% |
| Immigrants | Uruguay | 52.8 /100 | #172 | Average 15.0% |
| Costa Ricans | 52.5 /100 | #173 | Average 15.0% |
Demographics Similar to Finns by Master's Degree
In terms of master's degree, the demographic groups most similar to Finns are Immigrants from Thailand (14.2%, a difference of 0.010%), Spanish (14.2%, a difference of 0.20%), Immigrants from Vietnam (14.1%, a difference of 0.21%), Somali (14.2%, a difference of 0.25%), and Immigrants from Somalia (14.1%, a difference of 0.27%).
| Demographics | Rating | Rank | Master's Degree |
| Immigrants | Bosnia and Herzegovina | 22.0 /100 | #207 | Fair 14.3% |
| Immigrants | Barbados | 20.5 /100 | #208 | Fair 14.3% |
| Immigrants | Panama | 20.0 /100 | #209 | Fair 14.3% |
| Sub-Saharan Africans | 19.4 /100 | #210 | Poor 14.2% |
| Somalis | 18.0 /100 | #211 | Poor 14.2% |
| Spanish | 17.8 /100 | #212 | Poor 14.2% |
| Immigrants | Thailand | 17.0 /100 | #213 | Poor 14.2% |
| Finns | 16.9 /100 | #214 | Poor 14.2% |
| Immigrants | Vietnam | 16.1 /100 | #215 | Poor 14.1% |
| Immigrants | Somalia | 15.8 /100 | #216 | Poor 14.1% |
| Immigrants | Trinidad and Tobago | 15.8 /100 | #217 | Poor 14.1% |
| French Canadians | 14.9 /100 | #218 | Poor 14.1% |
| Norwegians | 13.6 /100 | #219 | Poor 14.0% |
| Germans | 13.1 /100 | #220 | Poor 14.0% |
| Koreans | 12.7 /100 | #221 | Poor 14.0% |