Spanish vs Immigrants from Kuwait Master's Degree
COMPARE
Spanish
Immigrants from Kuwait
Master's Degree
Master's Degree Comparison
Spanish
Immigrants from Kuwait
14.2%
MASTER'S DEGREE
17.8/ 100
METRIC RATING
212th/ 347
METRIC RANK
18.6%
MASTER'S DEGREE
100.0/ 100
METRIC RATING
52nd/ 347
METRIC RANK
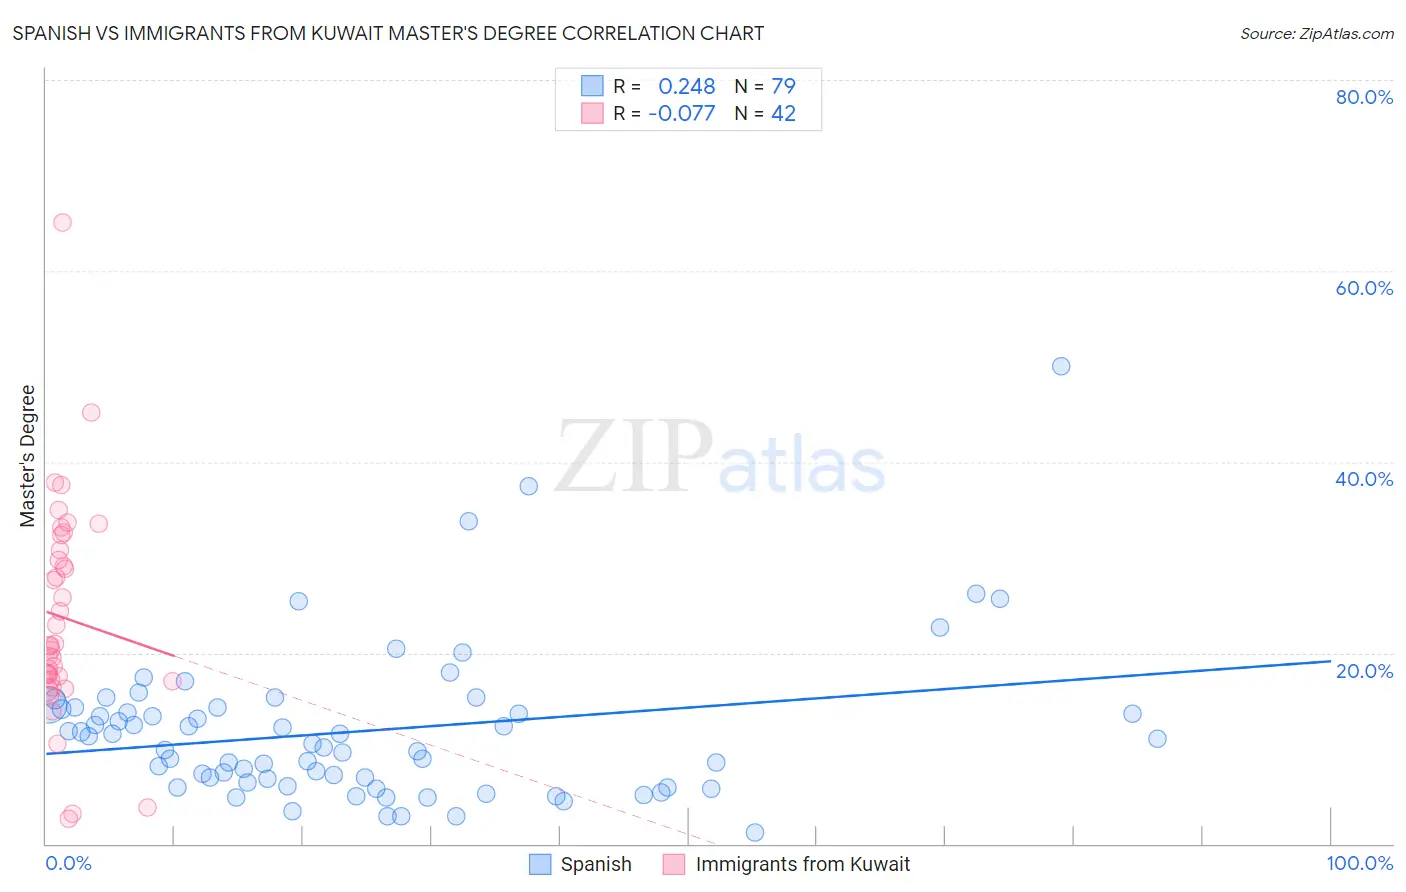
Spanish vs Immigrants from Kuwait Master's Degree Correlation Chart
The statistical analysis conducted on geographies consisting of 421,994,419 people shows a weak positive correlation between the proportion of Spanish and percentage of population with at least master's degree education in the United States with a correlation coefficient (R) of 0.248 and weighted average of 14.2%. Similarly, the statistical analysis conducted on geographies consisting of 136,916,630 people shows a slight negative correlation between the proportion of Immigrants from Kuwait and percentage of population with at least master's degree education in the United States with a correlation coefficient (R) of -0.077 and weighted average of 18.6%, a difference of 30.8%.
Master's Degree Correlation Summary
| Measurement | Spanish | Immigrants from Kuwait |
| Minimum | 1.2% | 2.6% |
| Maximum | 50.0% | 65.1% |
| Range | 48.8% | 62.5% |
| Mean | 11.8% | 23.7% |
| Median | 10.5% | 20.7% |
| Interquartile 25% (IQ1) | 6.4% | 17.1% |
| Interquartile 75% (IQ3) | 14.3% | 30.8% |
| Interquartile Range (IQR) | 7.9% | 13.7% |
| Standard Deviation (Sample) | 8.0% | 11.5% |
| Standard Deviation (Population) | 7.9% | 11.4% |
Similar Demographics by Master's Degree
Demographics Similar to Spanish by Master's Degree
In terms of master's degree, the demographic groups most similar to Spanish are Somali (14.2%, a difference of 0.050%), Immigrants from Thailand (14.2%, a difference of 0.19%), Finnish (14.2%, a difference of 0.20%), Subsaharan African (14.2%, a difference of 0.36%), and Immigrants from Vietnam (14.1%, a difference of 0.41%).
| Demographics | Rating | Rank | Master's Degree |
| Trinidadians and Tobagonians | 23.5 /100 | #205 | Fair 14.4% |
| Scandinavians | 23.3 /100 | #206 | Fair 14.4% |
| Immigrants | Bosnia and Herzegovina | 22.0 /100 | #207 | Fair 14.3% |
| Immigrants | Barbados | 20.5 /100 | #208 | Fair 14.3% |
| Immigrants | Panama | 20.0 /100 | #209 | Fair 14.3% |
| Sub-Saharan Africans | 19.4 /100 | #210 | Poor 14.2% |
| Somalis | 18.0 /100 | #211 | Poor 14.2% |
| Spanish | 17.8 /100 | #212 | Poor 14.2% |
| Immigrants | Thailand | 17.0 /100 | #213 | Poor 14.2% |
| Finns | 16.9 /100 | #214 | Poor 14.2% |
| Immigrants | Vietnam | 16.1 /100 | #215 | Poor 14.1% |
| Immigrants | Somalia | 15.8 /100 | #216 | Poor 14.1% |
| Immigrants | Trinidad and Tobago | 15.8 /100 | #217 | Poor 14.1% |
| French Canadians | 14.9 /100 | #218 | Poor 14.1% |
| Norwegians | 13.6 /100 | #219 | Poor 14.0% |
Demographics Similar to Immigrants from Kuwait by Master's Degree
In terms of master's degree, the demographic groups most similar to Immigrants from Kuwait are Immigrants from Czechoslovakia (18.5%, a difference of 0.080%), Immigrants from Lithuania (18.5%, a difference of 0.39%), Immigrants from Serbia (18.5%, a difference of 0.42%), Asian (18.4%, a difference of 0.65%), and Immigrants from Asia (18.4%, a difference of 0.79%).
| Demographics | Rating | Rank | Master's Degree |
| Immigrants | Belarus | 100.0 /100 | #45 | Exceptional 18.9% |
| Immigrants | Norway | 100.0 /100 | #46 | Exceptional 18.8% |
| Immigrants | Austria | 100.0 /100 | #47 | Exceptional 18.8% |
| Paraguayans | 100.0 /100 | #48 | Exceptional 18.8% |
| Estonians | 100.0 /100 | #49 | Exceptional 18.8% |
| Bulgarians | 100.0 /100 | #50 | Exceptional 18.8% |
| Immigrants | South Africa | 100.0 /100 | #51 | Exceptional 18.8% |
| Immigrants | Kuwait | 100.0 /100 | #52 | Exceptional 18.6% |
| Immigrants | Czechoslovakia | 99.9 /100 | #53 | Exceptional 18.5% |
| Immigrants | Lithuania | 99.9 /100 | #54 | Exceptional 18.5% |
| Immigrants | Serbia | 99.9 /100 | #55 | Exceptional 18.5% |
| Asians | 99.9 /100 | #56 | Exceptional 18.4% |
| Immigrants | Asia | 99.9 /100 | #57 | Exceptional 18.4% |
| Australians | 99.9 /100 | #58 | Exceptional 18.4% |
| Immigrants | Bulgaria | 99.9 /100 | #59 | Exceptional 18.3% |