Spanish vs Immigrants from Ecuador 10th Grade
COMPARE
Spanish
Immigrants from Ecuador
10th Grade
10th Grade Comparison
Spanish
Immigrants from Ecuador
94.0%
10TH GRADE
74.9/ 100
METRIC RATING
155th/ 347
METRIC RANK
90.4%
10TH GRADE
0.0/ 100
METRIC RATING
317th/ 347
METRIC RANK
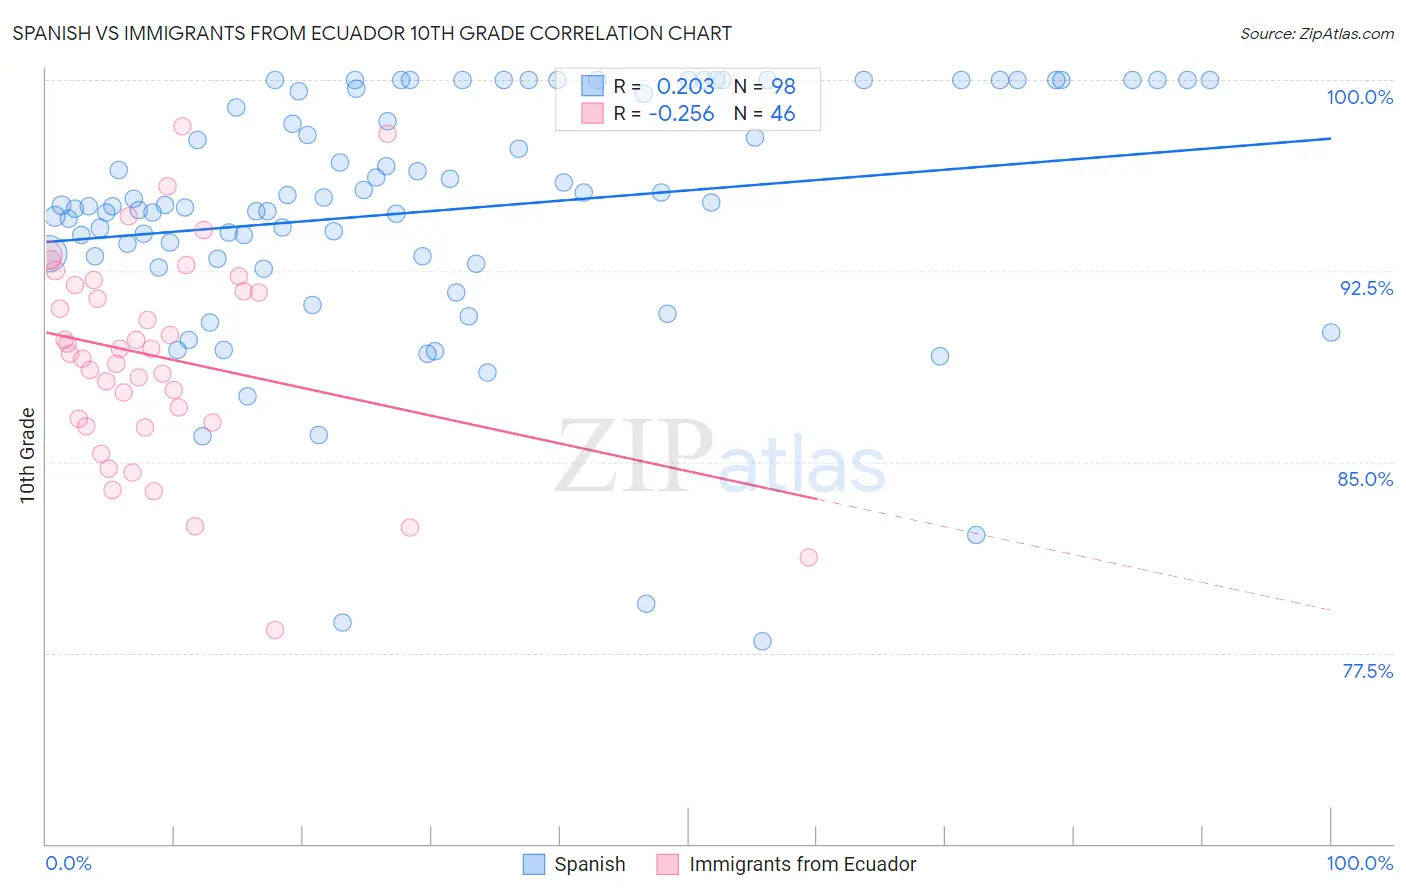
Spanish vs Immigrants from Ecuador 10th Grade Correlation Chart
The statistical analysis conducted on geographies consisting of 422,189,188 people shows a weak positive correlation between the proportion of Spanish and percentage of population with at least 10th grade education in the United States with a correlation coefficient (R) of 0.203 and weighted average of 94.0%. Similarly, the statistical analysis conducted on geographies consisting of 270,907,929 people shows a weak negative correlation between the proportion of Immigrants from Ecuador and percentage of population with at least 10th grade education in the United States with a correlation coefficient (R) of -0.256 and weighted average of 90.4%, a difference of 3.9%.
10th Grade Correlation Summary
| Measurement | Spanish | Immigrants from Ecuador |
| Minimum | 77.9% | 78.4% |
| Maximum | 100.0% | 98.2% |
| Range | 22.1% | 19.8% |
| Mean | 94.9% | 89.1% |
| Median | 95.1% | 89.3% |
| Interquartile 25% (IQ1) | 93.1% | 86.5% |
| Interquartile 75% (IQ3) | 99.7% | 91.9% |
| Interquartile Range (IQR) | 6.6% | 5.4% |
| Standard Deviation (Sample) | 4.9% | 4.2% |
| Standard Deviation (Population) | 4.8% | 4.1% |
Similar Demographics by 10th Grade
Demographics Similar to Spanish by 10th Grade
In terms of 10th grade, the demographic groups most similar to Spanish are Immigrants from Kenya (94.0%, a difference of 0.0%), Immigrants from Brazil (94.0%, a difference of 0.010%), Mongolian (94.0%, a difference of 0.010%), Kiowa (93.9%, a difference of 0.020%), and Immigrants from Italy (94.0%, a difference of 0.040%).
| Demographics | Rating | Rank | 10th Grade |
| Arabs | 80.9 /100 | #148 | Excellent 94.0% |
| Ugandans | 80.7 /100 | #149 | Excellent 94.0% |
| Egyptians | 79.6 /100 | #150 | Good 94.0% |
| Kenyans | 79.1 /100 | #151 | Good 94.0% |
| Immigrants | Italy | 78.0 /100 | #152 | Good 94.0% |
| Immigrants | Brazil | 75.5 /100 | #153 | Good 94.0% |
| Immigrants | Kenya | 75.3 /100 | #154 | Good 94.0% |
| Spanish | 74.9 /100 | #155 | Good 94.0% |
| Mongolians | 74.4 /100 | #156 | Good 94.0% |
| Kiowa | 73.3 /100 | #157 | Good 93.9% |
| Bermudans | 71.0 /100 | #158 | Good 93.9% |
| Chileans | 70.2 /100 | #159 | Good 93.9% |
| Pakistanis | 70.1 /100 | #160 | Good 93.9% |
| Assyrians/Chaldeans/Syriacs | 69.7 /100 | #161 | Good 93.9% |
| Immigrants | Poland | 69.6 /100 | #162 | Good 93.9% |
Demographics Similar to Immigrants from Ecuador by 10th Grade
In terms of 10th grade, the demographic groups most similar to Immigrants from Ecuador are Ecuadorian (90.6%, a difference of 0.17%), Immigrants from Caribbean (90.6%, a difference of 0.18%), Immigrants from Cuba (90.2%, a difference of 0.23%), Nepalese (90.7%, a difference of 0.26%), and Nicaraguan (90.2%, a difference of 0.31%).
| Demographics | Rating | Rank | 10th Grade |
| Vietnamese | 0.0 /100 | #310 | Tragic 90.9% |
| Immigrants | Cambodia | 0.0 /100 | #311 | Tragic 90.9% |
| Immigrants | Portugal | 0.0 /100 | #312 | Tragic 90.8% |
| Cape Verdeans | 0.0 /100 | #313 | Tragic 90.8% |
| Nepalese | 0.0 /100 | #314 | Tragic 90.7% |
| Immigrants | Caribbean | 0.0 /100 | #315 | Tragic 90.6% |
| Ecuadorians | 0.0 /100 | #316 | Tragic 90.6% |
| Immigrants | Ecuador | 0.0 /100 | #317 | Tragic 90.4% |
| Immigrants | Cuba | 0.0 /100 | #318 | Tragic 90.2% |
| Nicaraguans | 0.0 /100 | #319 | Tragic 90.2% |
| Houma | 0.0 /100 | #320 | Tragic 90.2% |
| Belizeans | 0.0 /100 | #321 | Tragic 90.2% |
| Tohono O'odham | 0.0 /100 | #322 | Tragic 90.1% |
| Immigrants | Belize | 0.0 /100 | #323 | Tragic 90.1% |
| Immigrants | Armenia | 0.0 /100 | #324 | Tragic 89.9% |