Spanish vs Immigrants from Ecuador 5th Grade
COMPARE
Spanish
Immigrants from Ecuador
5th Grade
5th Grade Comparison
Spanish
Immigrants from Ecuador
97.6%
5TH GRADE
93.7/ 100
METRIC RATING
124th/ 347
METRIC RANK
95.8%
5TH GRADE
0.0/ 100
METRIC RATING
316th/ 347
METRIC RANK
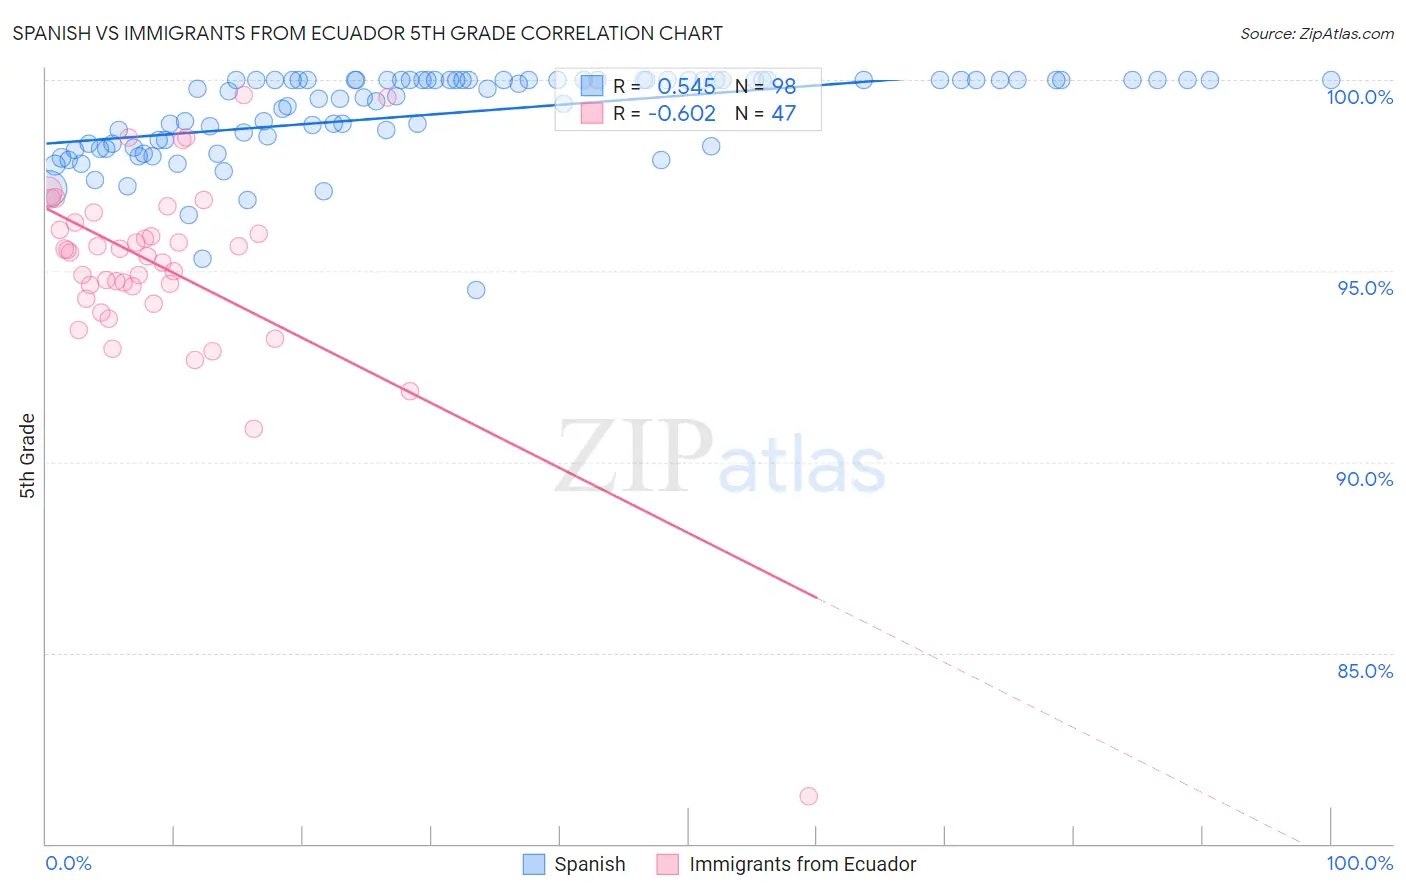
Spanish vs Immigrants from Ecuador 5th Grade Correlation Chart
The statistical analysis conducted on geographies consisting of 422,189,188 people shows a substantial positive correlation between the proportion of Spanish and percentage of population with at least 5th grade education in the United States with a correlation coefficient (R) of 0.545 and weighted average of 97.6%. Similarly, the statistical analysis conducted on geographies consisting of 271,020,679 people shows a significant negative correlation between the proportion of Immigrants from Ecuador and percentage of population with at least 5th grade education in the United States with a correlation coefficient (R) of -0.602 and weighted average of 95.8%, a difference of 1.8%.
5th Grade Correlation Summary
| Measurement | Spanish | Immigrants from Ecuador |
| Minimum | 94.5% | 81.2% |
| Maximum | 100.0% | 99.6% |
| Range | 5.5% | 18.3% |
| Mean | 99.1% | 95.1% |
| Median | 99.7% | 95.5% |
| Interquartile 25% (IQ1) | 98.3% | 94.3% |
| Interquartile 75% (IQ3) | 100.0% | 96.3% |
| Interquartile Range (IQR) | 1.7% | 2.0% |
| Standard Deviation (Sample) | 1.1% | 2.7% |
| Standard Deviation (Population) | 1.1% | 2.7% |
Similar Demographics by 5th Grade
Demographics Similar to Spanish by 5th Grade
In terms of 5th grade, the demographic groups most similar to Spanish are Immigrants from Bulgaria (97.6%, a difference of 0.010%), Immigrants from Zimbabwe (97.6%, a difference of 0.020%), Immigrants from France (97.6%, a difference of 0.020%), Immigrants from Japan (97.6%, a difference of 0.020%), and Immigrants from Norway (97.6%, a difference of 0.020%).
| Demographics | Rating | Rank | 5th Grade |
| Immigrants | Saudi Arabia | 95.4 /100 | #117 | Exceptional 97.6% |
| Basques | 95.2 /100 | #118 | Exceptional 97.6% |
| Syrians | 95.1 /100 | #119 | Exceptional 97.6% |
| Immigrants | Zimbabwe | 94.9 /100 | #120 | Exceptional 97.6% |
| Immigrants | France | 94.8 /100 | #121 | Exceptional 97.6% |
| Immigrants | Japan | 94.7 /100 | #122 | Exceptional 97.6% |
| Immigrants | Norway | 94.6 /100 | #123 | Exceptional 97.6% |
| Spanish | 93.7 /100 | #124 | Exceptional 97.6% |
| Immigrants | Bulgaria | 93.1 /100 | #125 | Exceptional 97.6% |
| Hmong | 92.3 /100 | #126 | Exceptional 97.6% |
| Immigrants | Serbia | 92.3 /100 | #127 | Exceptional 97.6% |
| Colville | 92.0 /100 | #128 | Exceptional 97.6% |
| Immigrants | Europe | 91.9 /100 | #129 | Exceptional 97.6% |
| Immigrants | Romania | 91.6 /100 | #130 | Exceptional 97.6% |
| Pima | 91.2 /100 | #131 | Exceptional 97.6% |
Demographics Similar to Immigrants from Ecuador by 5th Grade
In terms of 5th grade, the demographic groups most similar to Immigrants from Ecuador are Belizean (95.8%, a difference of 0.030%), Immigrants from Vietnam (95.8%, a difference of 0.050%), Nicaraguan (95.9%, a difference of 0.060%), Bangladeshi (95.9%, a difference of 0.080%), and Immigrants from Portugal (95.9%, a difference of 0.080%).
| Demographics | Rating | Rank | 5th Grade |
| Immigrants | Guyana | 0.0 /100 | #309 | Tragic 96.0% |
| Indonesians | 0.0 /100 | #310 | Tragic 96.0% |
| Immigrants | Bangladesh | 0.0 /100 | #311 | Tragic 96.0% |
| Vietnamese | 0.0 /100 | #312 | Tragic 95.9% |
| Bangladeshis | 0.0 /100 | #313 | Tragic 95.9% |
| Immigrants | Portugal | 0.0 /100 | #314 | Tragic 95.9% |
| Nicaraguans | 0.0 /100 | #315 | Tragic 95.9% |
| Immigrants | Ecuador | 0.0 /100 | #316 | Tragic 95.8% |
| Belizeans | 0.0 /100 | #317 | Tragic 95.8% |
| Immigrants | Vietnam | 0.0 /100 | #318 | Tragic 95.8% |
| Japanese | 0.0 /100 | #319 | Tragic 95.7% |
| Central American Indians | 0.0 /100 | #320 | Tragic 95.7% |
| Immigrants | Belize | 0.0 /100 | #321 | Tragic 95.7% |
| Immigrants | Nicaragua | 0.0 /100 | #322 | Tragic 95.6% |
| Immigrants | Fiji | 0.0 /100 | #323 | Tragic 95.6% |