Spanish vs Immigrants from Uzbekistan Master's Degree
COMPARE
Spanish
Immigrants from Uzbekistan
Master's Degree
Master's Degree Comparison
Spanish
Immigrants from Uzbekistan
14.2%
MASTER'S DEGREE
17.8/ 100
METRIC RATING
212th/ 347
METRIC RANK
17.9%
MASTER'S DEGREE
99.8/ 100
METRIC RATING
69th/ 347
METRIC RANK
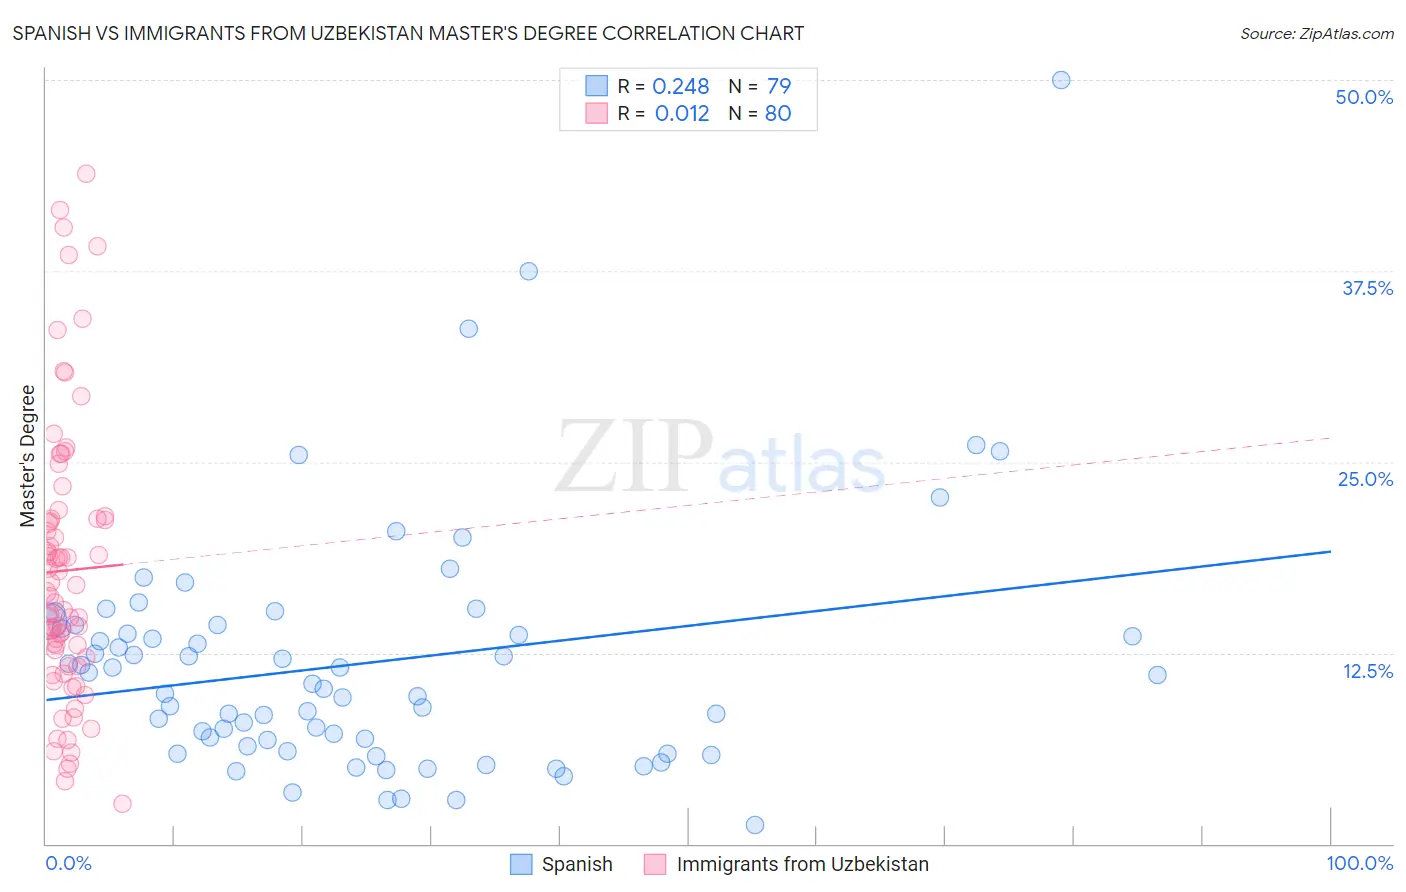
Spanish vs Immigrants from Uzbekistan Master's Degree Correlation Chart
The statistical analysis conducted on geographies consisting of 421,994,419 people shows a weak positive correlation between the proportion of Spanish and percentage of population with at least master's degree education in the United States with a correlation coefficient (R) of 0.248 and weighted average of 14.2%. Similarly, the statistical analysis conducted on geographies consisting of 118,739,422 people shows no correlation between the proportion of Immigrants from Uzbekistan and percentage of population with at least master's degree education in the United States with a correlation coefficient (R) of 0.012 and weighted average of 17.9%, a difference of 25.9%.
Master's Degree Correlation Summary
| Measurement | Spanish | Immigrants from Uzbekistan |
| Minimum | 1.2% | 2.6% |
| Maximum | 50.0% | 43.9% |
| Range | 48.8% | 41.3% |
| Mean | 11.8% | 17.9% |
| Median | 10.5% | 16.3% |
| Interquartile 25% (IQ1) | 6.4% | 11.9% |
| Interquartile 75% (IQ3) | 14.3% | 21.3% |
| Interquartile Range (IQR) | 7.9% | 9.4% |
| Standard Deviation (Sample) | 8.0% | 9.0% |
| Standard Deviation (Population) | 7.9% | 9.0% |
Similar Demographics by Master's Degree
Demographics Similar to Spanish by Master's Degree
In terms of master's degree, the demographic groups most similar to Spanish are Somali (14.2%, a difference of 0.050%), Immigrants from Thailand (14.2%, a difference of 0.19%), Finnish (14.2%, a difference of 0.20%), Subsaharan African (14.2%, a difference of 0.36%), and Immigrants from Vietnam (14.1%, a difference of 0.41%).
| Demographics | Rating | Rank | Master's Degree |
| Trinidadians and Tobagonians | 23.5 /100 | #205 | Fair 14.4% |
| Scandinavians | 23.3 /100 | #206 | Fair 14.4% |
| Immigrants | Bosnia and Herzegovina | 22.0 /100 | #207 | Fair 14.3% |
| Immigrants | Barbados | 20.5 /100 | #208 | Fair 14.3% |
| Immigrants | Panama | 20.0 /100 | #209 | Fair 14.3% |
| Sub-Saharan Africans | 19.4 /100 | #210 | Poor 14.2% |
| Somalis | 18.0 /100 | #211 | Poor 14.2% |
| Spanish | 17.8 /100 | #212 | Poor 14.2% |
| Immigrants | Thailand | 17.0 /100 | #213 | Poor 14.2% |
| Finns | 16.9 /100 | #214 | Poor 14.2% |
| Immigrants | Vietnam | 16.1 /100 | #215 | Poor 14.1% |
| Immigrants | Somalia | 15.8 /100 | #216 | Poor 14.1% |
| Immigrants | Trinidad and Tobago | 15.8 /100 | #217 | Poor 14.1% |
| French Canadians | 14.9 /100 | #218 | Poor 14.1% |
| Norwegians | 13.6 /100 | #219 | Poor 14.0% |
Demographics Similar to Immigrants from Uzbekistan by Master's Degree
In terms of master's degree, the demographic groups most similar to Immigrants from Uzbekistan are Immigrants from Western Europe (17.8%, a difference of 0.22%), Immigrants from Ethiopia (17.9%, a difference of 0.33%), Immigrants from Pakistan (17.8%, a difference of 0.50%), Immigrants from Argentina (18.0%, a difference of 0.55%), and Ethiopian (18.0%, a difference of 0.60%).
| Demographics | Rating | Rank | Master's Degree |
| Argentineans | 99.9 /100 | #62 | Exceptional 18.2% |
| Immigrants | Netherlands | 99.9 /100 | #63 | Exceptional 18.1% |
| South Africans | 99.9 /100 | #64 | Exceptional 18.1% |
| Immigrants | Kazakhstan | 99.8 /100 | #65 | Exceptional 18.0% |
| Ethiopians | 99.8 /100 | #66 | Exceptional 18.0% |
| Immigrants | Argentina | 99.8 /100 | #67 | Exceptional 18.0% |
| Immigrants | Ethiopia | 99.8 /100 | #68 | Exceptional 17.9% |
| Immigrants | Uzbekistan | 99.8 /100 | #69 | Exceptional 17.9% |
| Immigrants | Western Europe | 99.8 /100 | #70 | Exceptional 17.8% |
| Immigrants | Pakistan | 99.7 /100 | #71 | Exceptional 17.8% |
| Lithuanians | 99.7 /100 | #72 | Exceptional 17.7% |
| Zimbabweans | 99.7 /100 | #73 | Exceptional 17.7% |
| Immigrants | Romania | 99.7 /100 | #74 | Exceptional 17.7% |
| Egyptians | 99.6 /100 | #75 | Exceptional 17.6% |
| Immigrants | Indonesia | 99.6 /100 | #76 | Exceptional 17.6% |