Spanish American vs Lumbee Householder Income Ages 25 - 44 years
COMPARE
Spanish American
Lumbee
Householder Income Ages 25 - 44 years
Householder Income Ages 25 - 44 years Comparison
Spanish Americans
Lumbee
$83,722
HOUSEHOLDER INCOME AGES 25 - 44 YEARS
0.2/ 100
METRIC RATING
272nd/ 347
METRIC RANK
$60,305
HOUSEHOLDER INCOME AGES 25 - 44 YEARS
0.0/ 100
METRIC RATING
347th/ 347
METRIC RANK
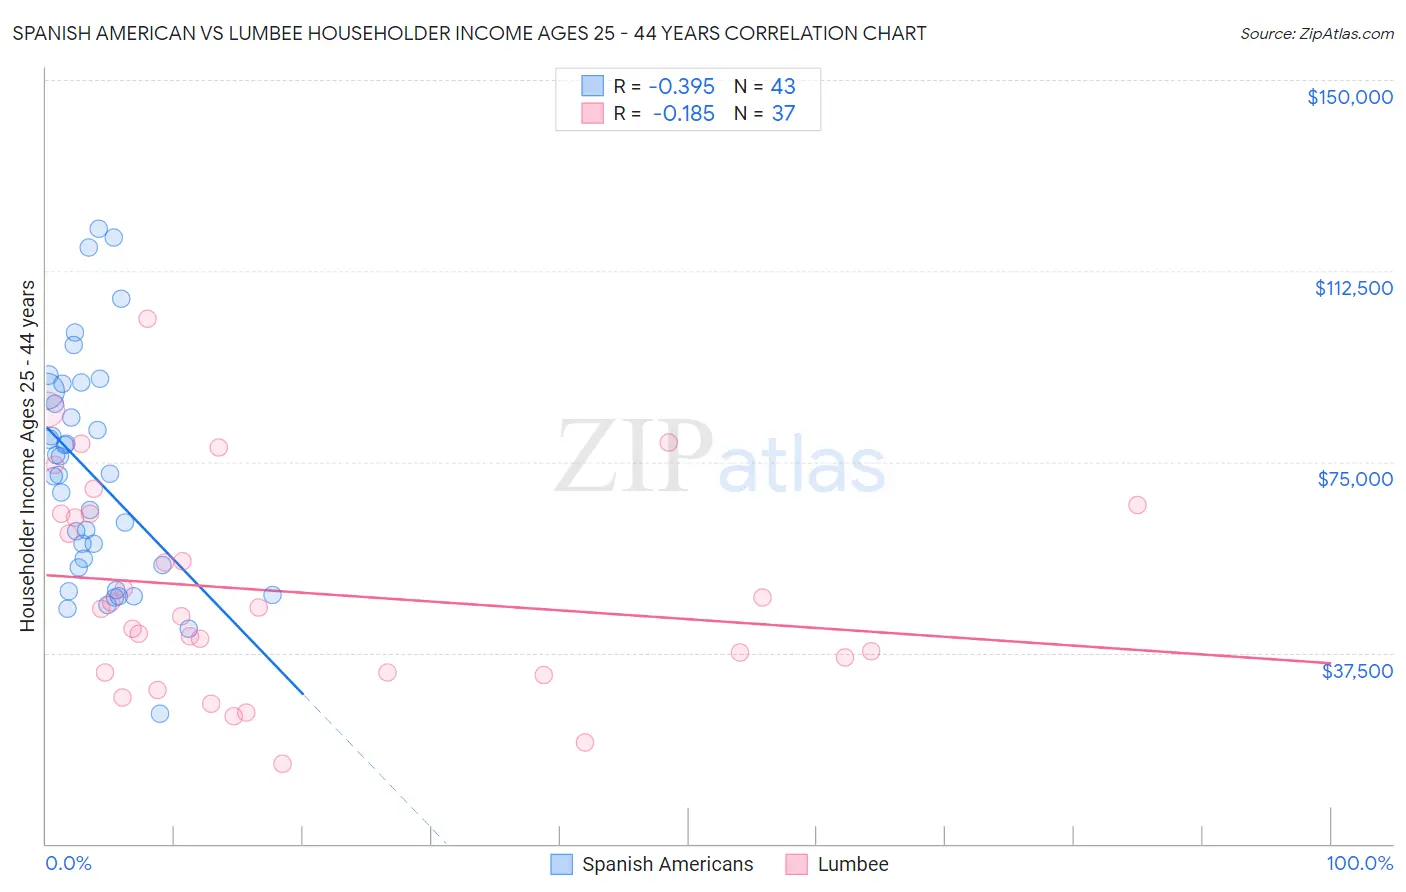
Spanish American vs Lumbee Householder Income Ages 25 - 44 years Correlation Chart
The statistical analysis conducted on geographies consisting of 103,075,966 people shows a mild negative correlation between the proportion of Spanish Americans and household income with householder between the ages 25 and 44 in the United States with a correlation coefficient (R) of -0.395 and weighted average of $83,722. Similarly, the statistical analysis conducted on geographies consisting of 92,171,944 people shows a poor negative correlation between the proportion of Lumbee and household income with householder between the ages 25 and 44 in the United States with a correlation coefficient (R) of -0.185 and weighted average of $60,305, a difference of 38.8%.
Householder Income Ages 25 - 44 years Correlation Summary
| Measurement | Spanish American | Lumbee |
| Minimum | $25,625 | $15,613 |
| Maximum | $120,725 | $103,229 |
| Range | $95,100 | $87,616 |
| Mean | $72,343 | $49,513 |
| Median | $72,340 | $46,151 |
| Interquartile 25% (IQ1) | $54,252 | $33,594 |
| Interquartile 75% (IQ3) | $88,756 | $64,818 |
| Interquartile Range (IQR) | $34,503 | $31,224 |
| Standard Deviation (Sample) | $22,283 | $20,339 |
| Standard Deviation (Population) | $22,022 | $20,063 |
Similar Demographics by Householder Income Ages 25 - 44 years
Demographics Similar to Spanish Americans by Householder Income Ages 25 - 44 years
In terms of householder income ages 25 - 44 years, the demographic groups most similar to Spanish Americans are Somali ($83,752, a difference of 0.040%), Iroquois ($83,682, a difference of 0.050%), Marshallese ($83,575, a difference of 0.18%), Jamaican ($83,933, a difference of 0.25%), and Spanish American Indian ($84,085, a difference of 0.43%).
| Demographics | Rating | Rank | Householder Income Ages 25 - 44 years |
| Sudanese | 0.4 /100 | #265 | Tragic $84,401 |
| Immigrants | Cabo Verde | 0.3 /100 | #266 | Tragic $84,304 |
| Hmong | 0.3 /100 | #267 | Tragic $84,258 |
| Sub-Saharan Africans | 0.3 /100 | #268 | Tragic $84,235 |
| Spanish American Indians | 0.3 /100 | #269 | Tragic $84,085 |
| Jamaicans | 0.3 /100 | #270 | Tragic $83,933 |
| Somalis | 0.2 /100 | #271 | Tragic $83,752 |
| Spanish Americans | 0.2 /100 | #272 | Tragic $83,722 |
| Iroquois | 0.2 /100 | #273 | Tragic $83,682 |
| Marshallese | 0.2 /100 | #274 | Tragic $83,575 |
| Immigrants | Jamaica | 0.2 /100 | #275 | Tragic $83,298 |
| Immigrants | Belize | 0.2 /100 | #276 | Tragic $83,141 |
| Paiute | 0.2 /100 | #277 | Tragic $82,984 |
| Senegalese | 0.2 /100 | #278 | Tragic $82,852 |
| Pima | 0.1 /100 | #279 | Tragic $82,821 |
Demographics Similar to Lumbee by Householder Income Ages 25 - 44 years
In terms of householder income ages 25 - 44 years, the demographic groups most similar to Lumbee are Puerto Rican ($65,996, a difference of 9.4%), Navajo ($66,529, a difference of 10.3%), Pueblo ($68,910, a difference of 14.3%), Tohono O'odham ($69,068, a difference of 14.5%), and Crow ($71,337, a difference of 18.3%).
| Demographics | Rating | Rank | Householder Income Ages 25 - 44 years |
| Hopi | 0.0 /100 | #333 | Tragic $75,002 |
| Creek | 0.0 /100 | #334 | Tragic $74,847 |
| Kiowa | 0.0 /100 | #335 | Tragic $74,776 |
| Yup'ik | 0.0 /100 | #336 | Tragic $73,688 |
| Blacks/African Americans | 0.0 /100 | #337 | Tragic $73,370 |
| Immigrants | Yemen | 0.0 /100 | #338 | Tragic $73,043 |
| Yuman | 0.0 /100 | #339 | Tragic $72,956 |
| Immigrants | Congo | 0.0 /100 | #340 | Tragic $72,178 |
| Arapaho | 0.0 /100 | #341 | Tragic $71,697 |
| Crow | 0.0 /100 | #342 | Tragic $71,337 |
| Tohono O'odham | 0.0 /100 | #343 | Tragic $69,068 |
| Pueblo | 0.0 /100 | #344 | Tragic $68,910 |
| Navajo | 0.0 /100 | #345 | Tragic $66,529 |
| Puerto Ricans | 0.0 /100 | #346 | Tragic $65,996 |
| Lumbee | 0.0 /100 | #347 | Tragic $60,305 |