Spanish American vs Croatian College, Under 1 year
COMPARE
Spanish American
Croatian
College, Under 1 year
College, Under 1 year Comparison
Spanish Americans
Croatians
62.6%
COLLEGE, UNDER 1 YEAR
1.9/ 100
METRIC RATING
235th/ 347
METRIC RANK
68.3%
COLLEGE, UNDER 1 YEAR
98.2/ 100
METRIC RATING
88th/ 347
METRIC RANK
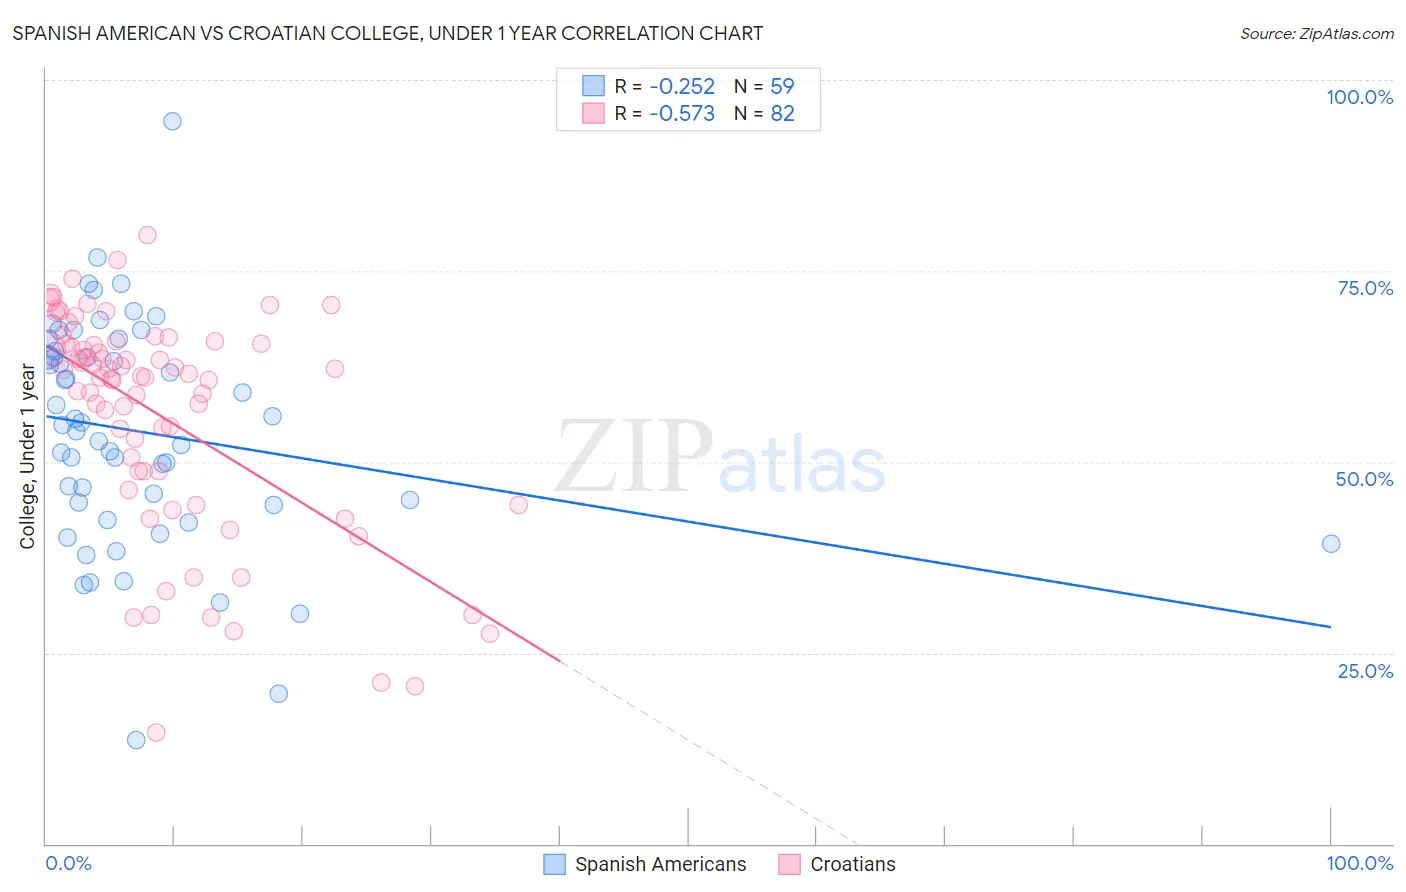
Spanish American vs Croatian College, Under 1 year Correlation Chart
The statistical analysis conducted on geographies consisting of 103,168,410 people shows a weak negative correlation between the proportion of Spanish Americans and percentage of population with at least college, under 1 year education in the United States with a correlation coefficient (R) of -0.252 and weighted average of 62.6%. Similarly, the statistical analysis conducted on geographies consisting of 375,730,237 people shows a substantial negative correlation between the proportion of Croatians and percentage of population with at least college, under 1 year education in the United States with a correlation coefficient (R) of -0.573 and weighted average of 68.3%, a difference of 9.2%.
College, Under 1 year Correlation Summary
| Measurement | Spanish American | Croatian |
| Minimum | 13.6% | 14.6% |
| Maximum | 94.7% | 79.7% |
| Range | 81.0% | 65.1% |
| Mean | 53.9% | 56.1% |
| Median | 54.9% | 61.1% |
| Interquartile 25% (IQ1) | 44.3% | 48.7% |
| Interquartile 75% (IQ3) | 64.5% | 65.5% |
| Interquartile Range (IQR) | 20.2% | 16.8% |
| Standard Deviation (Sample) | 14.8% | 14.5% |
| Standard Deviation (Population) | 14.7% | 14.5% |
Similar Demographics by College, Under 1 year
Demographics Similar to Spanish Americans by College, Under 1 year
In terms of college, under 1 year, the demographic groups most similar to Spanish Americans are Chippewa (62.6%, a difference of 0.050%), Iroquois (62.6%, a difference of 0.080%), Immigrants (62.5%, a difference of 0.13%), Immigrants from Burma/Myanmar (62.5%, a difference of 0.16%), and Osage (62.7%, a difference of 0.20%).
| Demographics | Rating | Rank | College, Under 1 year |
| Samoans | 3.3 /100 | #228 | Tragic 63.0% |
| Liberians | 3.2 /100 | #229 | Tragic 63.0% |
| Immigrants | Nonimmigrants | 3.0 /100 | #230 | Tragic 62.9% |
| Immigrants | Western Africa | 2.4 /100 | #231 | Tragic 62.8% |
| Osage | 2.2 /100 | #232 | Tragic 62.7% |
| Iroquois | 2.0 /100 | #233 | Tragic 62.6% |
| Chippewa | 2.0 /100 | #234 | Tragic 62.6% |
| Spanish Americans | 1.9 /100 | #235 | Tragic 62.6% |
| Immigrants | Immigrants | 1.7 /100 | #236 | Tragic 62.5% |
| Immigrants | Burma/Myanmar | 1.6 /100 | #237 | Tragic 62.5% |
| French American Indians | 1.5 /100 | #238 | Tragic 62.4% |
| Nepalese | 1.1 /100 | #239 | Tragic 62.2% |
| Aleuts | 1.1 /100 | #240 | Tragic 62.2% |
| Ottawa | 1.1 /100 | #241 | Tragic 62.2% |
| Malaysians | 1.1 /100 | #242 | Tragic 62.2% |
Demographics Similar to Croatians by College, Under 1 year
In terms of college, under 1 year, the demographic groups most similar to Croatians are Ethiopian (68.3%, a difference of 0.010%), Chinese (68.3%, a difference of 0.020%), Immigrants from Lebanon (68.3%, a difference of 0.040%), Immigrants from Hungary (68.3%, a difference of 0.050%), and Egyptian (68.3%, a difference of 0.050%).
| Demographics | Rating | Rank | College, Under 1 year |
| Immigrants | Greece | 98.5 /100 | #81 | Exceptional 68.4% |
| Norwegians | 98.4 /100 | #82 | Exceptional 68.4% |
| Argentineans | 98.4 /100 | #83 | Exceptional 68.4% |
| Immigrants | Hungary | 98.3 /100 | #84 | Exceptional 68.3% |
| Egyptians | 98.3 /100 | #85 | Exceptional 68.3% |
| Immigrants | Lebanon | 98.3 /100 | #86 | Exceptional 68.3% |
| Chinese | 98.3 /100 | #87 | Exceptional 68.3% |
| Croatians | 98.2 /100 | #88 | Exceptional 68.3% |
| Ethiopians | 98.2 /100 | #89 | Exceptional 68.3% |
| Icelanders | 98.1 /100 | #90 | Exceptional 68.3% |
| Europeans | 98.1 /100 | #91 | Exceptional 68.2% |
| Luxembourgers | 98.1 /100 | #92 | Exceptional 68.2% |
| Romanians | 97.9 /100 | #93 | Exceptional 68.2% |
| Armenians | 97.7 /100 | #94 | Exceptional 68.1% |
| Immigrants | Pakistan | 97.5 /100 | #95 | Exceptional 68.0% |