Spanish American vs Immigrants from China College, Under 1 year
COMPARE
Spanish American
Immigrants from China
College, Under 1 year
College, Under 1 year Comparison
Spanish Americans
Immigrants from China
62.6%
COLLEGE, UNDER 1 YEAR
1.9/ 100
METRIC RATING
235th/ 347
METRIC RANK
70.9%
COLLEGE, UNDER 1 YEAR
99.9/ 100
METRIC RATING
30th/ 347
METRIC RANK
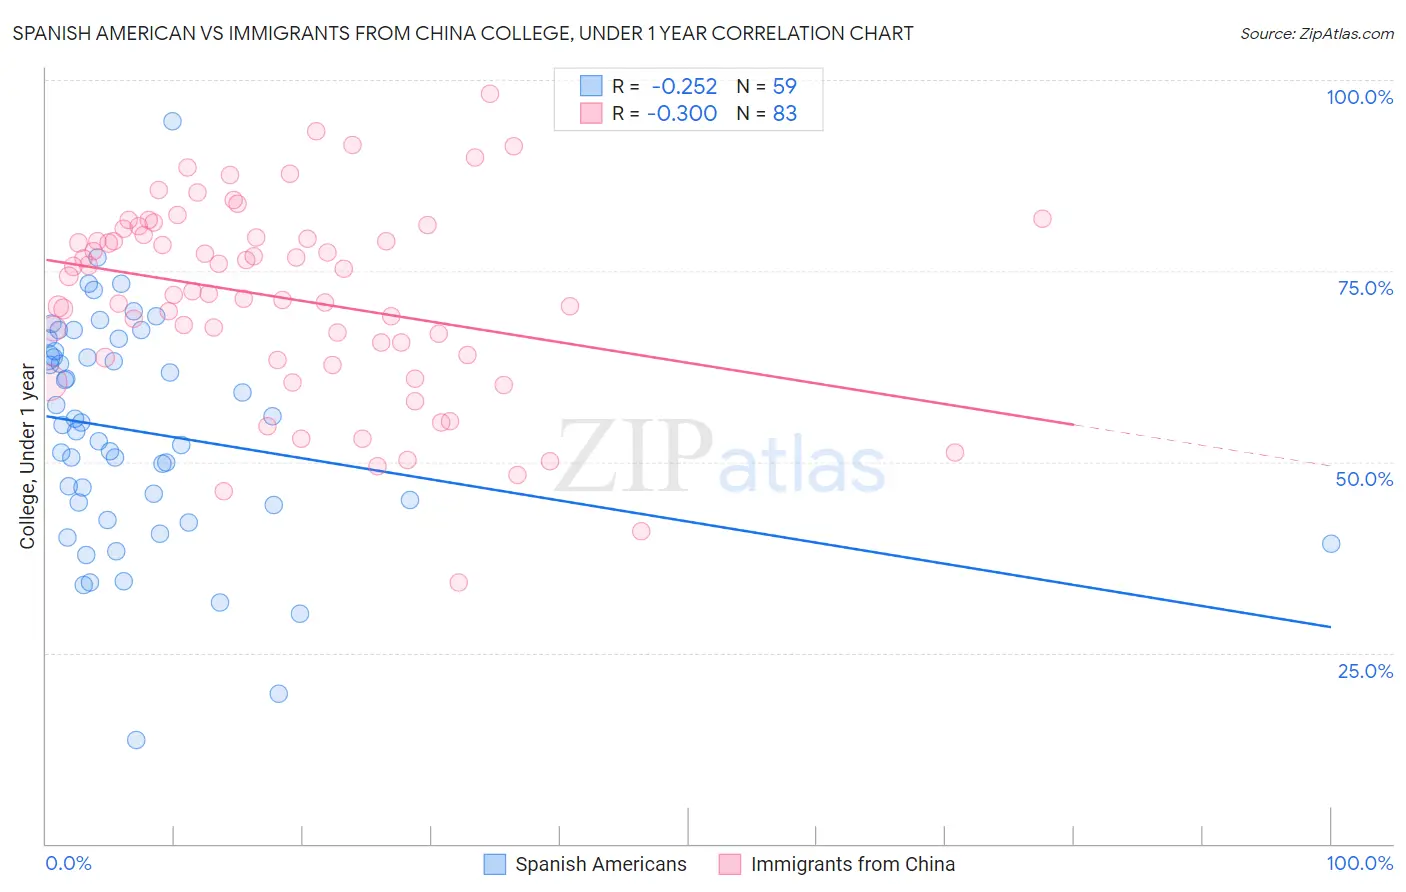
Spanish American vs Immigrants from China College, Under 1 year Correlation Chart
The statistical analysis conducted on geographies consisting of 103,168,410 people shows a weak negative correlation between the proportion of Spanish Americans and percentage of population with at least college, under 1 year education in the United States with a correlation coefficient (R) of -0.252 and weighted average of 62.6%. Similarly, the statistical analysis conducted on geographies consisting of 457,079,223 people shows a mild negative correlation between the proportion of Immigrants from China and percentage of population with at least college, under 1 year education in the United States with a correlation coefficient (R) of -0.300 and weighted average of 70.9%, a difference of 13.2%.
College, Under 1 year Correlation Summary
| Measurement | Spanish American | Immigrants from China |
| Minimum | 13.6% | 34.2% |
| Maximum | 94.7% | 98.2% |
| Range | 81.0% | 64.0% |
| Mean | 53.9% | 71.4% |
| Median | 54.9% | 72.4% |
| Interquartile 25% (IQ1) | 44.3% | 63.6% |
| Interquartile 75% (IQ3) | 64.5% | 79.7% |
| Interquartile Range (IQR) | 20.2% | 16.1% |
| Standard Deviation (Sample) | 14.8% | 12.8% |
| Standard Deviation (Population) | 14.7% | 12.7% |
Similar Demographics by College, Under 1 year
Demographics Similar to Spanish Americans by College, Under 1 year
In terms of college, under 1 year, the demographic groups most similar to Spanish Americans are Chippewa (62.6%, a difference of 0.050%), Iroquois (62.6%, a difference of 0.080%), Immigrants (62.5%, a difference of 0.13%), Immigrants from Burma/Myanmar (62.5%, a difference of 0.16%), and Osage (62.7%, a difference of 0.20%).
| Demographics | Rating | Rank | College, Under 1 year |
| Samoans | 3.3 /100 | #228 | Tragic 63.0% |
| Liberians | 3.2 /100 | #229 | Tragic 63.0% |
| Immigrants | Nonimmigrants | 3.0 /100 | #230 | Tragic 62.9% |
| Immigrants | Western Africa | 2.4 /100 | #231 | Tragic 62.8% |
| Osage | 2.2 /100 | #232 | Tragic 62.7% |
| Iroquois | 2.0 /100 | #233 | Tragic 62.6% |
| Chippewa | 2.0 /100 | #234 | Tragic 62.6% |
| Spanish Americans | 1.9 /100 | #235 | Tragic 62.6% |
| Immigrants | Immigrants | 1.7 /100 | #236 | Tragic 62.5% |
| Immigrants | Burma/Myanmar | 1.6 /100 | #237 | Tragic 62.5% |
| French American Indians | 1.5 /100 | #238 | Tragic 62.4% |
| Nepalese | 1.1 /100 | #239 | Tragic 62.2% |
| Aleuts | 1.1 /100 | #240 | Tragic 62.2% |
| Ottawa | 1.1 /100 | #241 | Tragic 62.2% |
| Malaysians | 1.1 /100 | #242 | Tragic 62.2% |
Demographics Similar to Immigrants from China by College, Under 1 year
In terms of college, under 1 year, the demographic groups most similar to Immigrants from China are Indian (Asian) (70.8%, a difference of 0.11%), Immigrants from Hong Kong (71.0%, a difference of 0.18%), Immigrants from France (71.0%, a difference of 0.18%), Turkish (70.7%, a difference of 0.19%), and Immigrants from Ireland (71.0%, a difference of 0.21%).
| Demographics | Rating | Rank | College, Under 1 year |
| Immigrants | Northern Europe | 100.0 /100 | #23 | Exceptional 71.1% |
| Soviet Union | 100.0 /100 | #24 | Exceptional 71.1% |
| Bulgarians | 100.0 /100 | #25 | Exceptional 71.1% |
| Immigrants | Denmark | 100.0 /100 | #26 | Exceptional 71.0% |
| Immigrants | Ireland | 100.0 /100 | #27 | Exceptional 71.0% |
| Immigrants | Hong Kong | 100.0 /100 | #28 | Exceptional 71.0% |
| Immigrants | France | 100.0 /100 | #29 | Exceptional 71.0% |
| Immigrants | China | 99.9 /100 | #30 | Exceptional 70.9% |
| Indians (Asian) | 99.9 /100 | #31 | Exceptional 70.8% |
| Turks | 99.9 /100 | #32 | Exceptional 70.7% |
| Immigrants | South Africa | 99.9 /100 | #33 | Exceptional 70.6% |
| Estonians | 99.9 /100 | #34 | Exceptional 70.6% |
| Russians | 99.9 /100 | #35 | Exceptional 70.5% |
| Immigrants | Sri Lanka | 99.9 /100 | #36 | Exceptional 70.5% |
| Immigrants | Saudi Arabia | 99.9 /100 | #37 | Exceptional 70.4% |