Spanish American vs Assyrian/Chaldean/Syriac College, Under 1 year
COMPARE
Spanish American
Assyrian/Chaldean/Syriac
College, Under 1 year
College, Under 1 year Comparison
Spanish Americans
Assyrians/Chaldeans/Syriacs
62.6%
COLLEGE, UNDER 1 YEAR
1.9/ 100
METRIC RATING
235th/ 347
METRIC RANK
67.7%
COLLEGE, UNDER 1 YEAR
95.8/ 100
METRIC RATING
110th/ 347
METRIC RANK
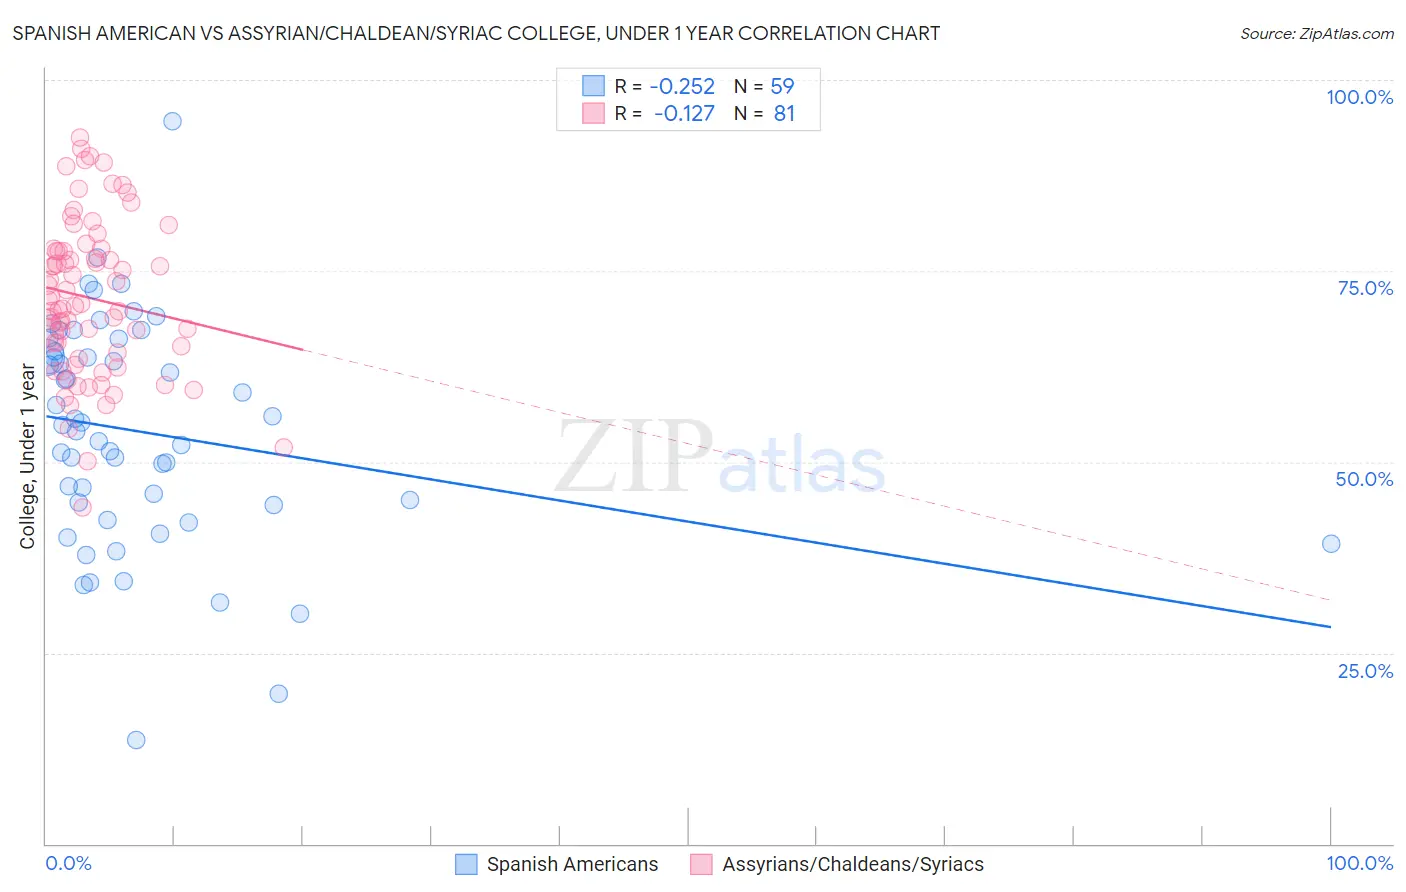
Spanish American vs Assyrian/Chaldean/Syriac College, Under 1 year Correlation Chart
The statistical analysis conducted on geographies consisting of 103,168,410 people shows a weak negative correlation between the proportion of Spanish Americans and percentage of population with at least college, under 1 year education in the United States with a correlation coefficient (R) of -0.252 and weighted average of 62.6%. Similarly, the statistical analysis conducted on geographies consisting of 110,318,304 people shows a poor negative correlation between the proportion of Assyrians/Chaldeans/Syriacs and percentage of population with at least college, under 1 year education in the United States with a correlation coefficient (R) of -0.127 and weighted average of 67.7%, a difference of 8.1%.
College, Under 1 year Correlation Summary
| Measurement | Spanish American | Assyrian/Chaldean/Syriac |
| Minimum | 13.6% | 44.0% |
| Maximum | 94.7% | 92.5% |
| Range | 81.0% | 48.5% |
| Mean | 53.9% | 71.5% |
| Median | 54.9% | 70.8% |
| Interquartile 25% (IQ1) | 44.3% | 63.9% |
| Interquartile 75% (IQ3) | 64.5% | 77.8% |
| Interquartile Range (IQR) | 20.2% | 13.9% |
| Standard Deviation (Sample) | 14.8% | 10.2% |
| Standard Deviation (Population) | 14.7% | 10.2% |
Similar Demographics by College, Under 1 year
Demographics Similar to Spanish Americans by College, Under 1 year
In terms of college, under 1 year, the demographic groups most similar to Spanish Americans are Chippewa (62.6%, a difference of 0.050%), Iroquois (62.6%, a difference of 0.080%), Immigrants (62.5%, a difference of 0.13%), Immigrants from Burma/Myanmar (62.5%, a difference of 0.16%), and Osage (62.7%, a difference of 0.20%).
| Demographics | Rating | Rank | College, Under 1 year |
| Samoans | 3.3 /100 | #228 | Tragic 63.0% |
| Liberians | 3.2 /100 | #229 | Tragic 63.0% |
| Immigrants | Nonimmigrants | 3.0 /100 | #230 | Tragic 62.9% |
| Immigrants | Western Africa | 2.4 /100 | #231 | Tragic 62.8% |
| Osage | 2.2 /100 | #232 | Tragic 62.7% |
| Iroquois | 2.0 /100 | #233 | Tragic 62.6% |
| Chippewa | 2.0 /100 | #234 | Tragic 62.6% |
| Spanish Americans | 1.9 /100 | #235 | Tragic 62.6% |
| Immigrants | Immigrants | 1.7 /100 | #236 | Tragic 62.5% |
| Immigrants | Burma/Myanmar | 1.6 /100 | #237 | Tragic 62.5% |
| French American Indians | 1.5 /100 | #238 | Tragic 62.4% |
| Nepalese | 1.1 /100 | #239 | Tragic 62.2% |
| Aleuts | 1.1 /100 | #240 | Tragic 62.2% |
| Ottawa | 1.1 /100 | #241 | Tragic 62.2% |
| Malaysians | 1.1 /100 | #242 | Tragic 62.2% |
Demographics Similar to Assyrians/Chaldeans/Syriacs by College, Under 1 year
In terms of college, under 1 year, the demographic groups most similar to Assyrians/Chaldeans/Syriacs are Scandinavian (67.7%, a difference of 0.0%), Ukrainian (67.7%, a difference of 0.0%), Macedonian (67.6%, a difference of 0.020%), Syrian (67.6%, a difference of 0.040%), and Immigrants from Egypt (67.7%, a difference of 0.060%).
| Demographics | Rating | Rank | College, Under 1 year |
| Carpatho Rusyns | 96.8 /100 | #103 | Exceptional 67.9% |
| Immigrants | Western Asia | 96.6 /100 | #104 | Exceptional 67.8% |
| Afghans | 96.6 /100 | #105 | Exceptional 67.8% |
| Immigrants | Croatia | 96.6 /100 | #106 | Exceptional 67.8% |
| Austrians | 96.4 /100 | #107 | Exceptional 67.8% |
| Immigrants | Egypt | 96.0 /100 | #108 | Exceptional 67.7% |
| Scandinavians | 95.8 /100 | #109 | Exceptional 67.7% |
| Assyrians/Chaldeans/Syriacs | 95.8 /100 | #110 | Exceptional 67.7% |
| Ukrainians | 95.8 /100 | #111 | Exceptional 67.7% |
| Macedonians | 95.7 /100 | #112 | Exceptional 67.6% |
| Syrians | 95.6 /100 | #113 | Exceptional 67.6% |
| Chileans | 95.3 /100 | #114 | Exceptional 67.6% |
| Basques | 95.2 /100 | #115 | Exceptional 67.6% |
| Immigrants | Nepal | 94.9 /100 | #116 | Exceptional 67.5% |
| Pakistanis | 94.8 /100 | #117 | Exceptional 67.5% |