Immigrants from Nigeria vs Slovak College, Under 1 year
COMPARE
Immigrants from Nigeria
Slovak
College, Under 1 year
College, Under 1 year Comparison
Immigrants from Nigeria
Slovaks
63.7%
COLLEGE, UNDER 1 YEAR
8.8/ 100
METRIC RATING
214th/ 347
METRIC RANK
64.7%
COLLEGE, UNDER 1 YEAR
26.7/ 100
METRIC RATING
193rd/ 347
METRIC RANK
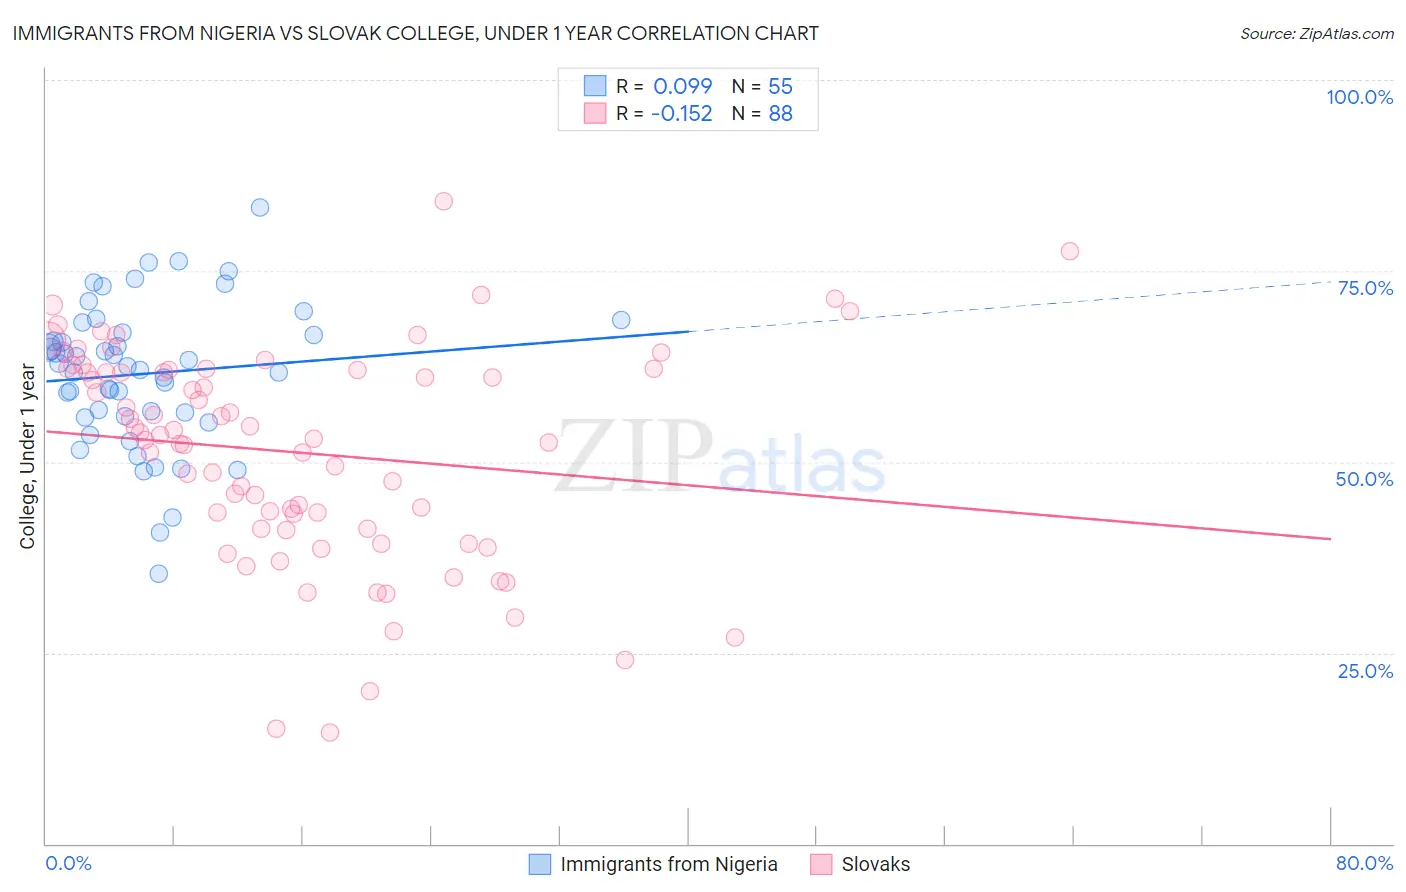
Immigrants from Nigeria vs Slovak College, Under 1 year Correlation Chart
The statistical analysis conducted on geographies consisting of 283,490,343 people shows a slight positive correlation between the proportion of Immigrants from Nigeria and percentage of population with at least college, under 1 year education in the United States with a correlation coefficient (R) of 0.099 and weighted average of 63.7%. Similarly, the statistical analysis conducted on geographies consisting of 397,891,856 people shows a poor negative correlation between the proportion of Slovaks and percentage of population with at least college, under 1 year education in the United States with a correlation coefficient (R) of -0.152 and weighted average of 64.7%, a difference of 1.5%.
College, Under 1 year Correlation Summary
| Measurement | Immigrants from Nigeria | Slovak |
| Minimum | 35.4% | 14.5% |
| Maximum | 83.3% | 84.1% |
| Range | 47.9% | 69.5% |
| Mean | 61.5% | 51.3% |
| Median | 62.6% | 53.3% |
| Interquartile 25% (IQ1) | 55.9% | 41.2% |
| Interquartile 75% (IQ3) | 67.0% | 62.0% |
| Interquartile Range (IQR) | 11.0% | 20.8% |
| Standard Deviation (Sample) | 9.4% | 14.1% |
| Standard Deviation (Population) | 9.3% | 14.0% |
Similar Demographics by College, Under 1 year
Demographics Similar to Immigrants from Nigeria by College, Under 1 year
In terms of college, under 1 year, the demographic groups most similar to Immigrants from Nigeria are Immigrants from South America (63.8%, a difference of 0.040%), Senegalese (63.6%, a difference of 0.17%), Immigrants from Middle Africa (63.9%, a difference of 0.22%), Native Hawaiian (63.9%, a difference of 0.23%), and Ghanaian (63.9%, a difference of 0.30%).
| Demographics | Rating | Rank | College, Under 1 year |
| Colombians | 12.4 /100 | #207 | Poor 64.0% |
| Immigrants | Vietnam | 12.1 /100 | #208 | Poor 64.0% |
| Puget Sound Salish | 11.3 /100 | #209 | Poor 63.9% |
| Ghanaians | 11.2 /100 | #210 | Poor 63.9% |
| Native Hawaiians | 10.6 /100 | #211 | Poor 63.9% |
| Immigrants | Middle Africa | 10.5 /100 | #212 | Poor 63.9% |
| Immigrants | South America | 9.1 /100 | #213 | Tragic 63.8% |
| Immigrants | Nigeria | 8.8 /100 | #214 | Tragic 63.7% |
| Senegalese | 7.7 /100 | #215 | Tragic 63.6% |
| Hmong | 6.8 /100 | #216 | Tragic 63.5% |
| Immigrants | Uruguay | 5.8 /100 | #217 | Tragic 63.4% |
| Immigrants | Panama | 5.7 /100 | #218 | Tragic 63.4% |
| Immigrants | Fiji | 5.7 /100 | #219 | Tragic 63.4% |
| Portuguese | 5.6 /100 | #220 | Tragic 63.4% |
| Cree | 5.2 /100 | #221 | Tragic 63.3% |
Demographics Similar to Slovaks by College, Under 1 year
In terms of college, under 1 year, the demographic groups most similar to Slovaks are Immigrants from Thailand (64.7%, a difference of 0.020%), Immigrants from Armenia (64.7%, a difference of 0.070%), Immigrants from Cameroon (64.6%, a difference of 0.13%), Immigrants from Philippines (64.8%, a difference of 0.19%), and Spanish (64.9%, a difference of 0.26%).
| Demographics | Rating | Rank | College, Under 1 year |
| Immigrants | Sierra Leone | 39.7 /100 | #186 | Fair 65.1% |
| Immigrants | Southern Europe | 34.3 /100 | #187 | Fair 64.9% |
| Immigrants | Albania | 32.0 /100 | #188 | Fair 64.9% |
| Spanish | 31.6 /100 | #189 | Fair 64.9% |
| Immigrants | Philippines | 30.1 /100 | #190 | Fair 64.8% |
| Immigrants | Armenia | 28.1 /100 | #191 | Fair 64.7% |
| Immigrants | Thailand | 27.0 /100 | #192 | Fair 64.7% |
| Slovaks | 26.7 /100 | #193 | Fair 64.7% |
| Immigrants | Cameroon | 24.6 /100 | #194 | Fair 64.6% |
| Immigrants | South Eastern Asia | 22.1 /100 | #195 | Fair 64.5% |
| Tongans | 21.2 /100 | #196 | Fair 64.5% |
| Costa Ricans | 19.6 /100 | #197 | Poor 64.4% |
| Tsimshian | 17.9 /100 | #198 | Poor 64.3% |
| Panamanians | 17.0 /100 | #199 | Poor 64.3% |
| Nigerians | 16.7 /100 | #200 | Poor 64.3% |