Immigrants from Kenya vs Slovak College, Under 1 year
COMPARE
Immigrants from Kenya
Slovak
College, Under 1 year
College, Under 1 year Comparison
Immigrants from Kenya
Slovaks
66.5%
COLLEGE, UNDER 1 YEAR
81.8/ 100
METRIC RATING
145th/ 347
METRIC RANK
64.7%
COLLEGE, UNDER 1 YEAR
26.7/ 100
METRIC RATING
193rd/ 347
METRIC RANK
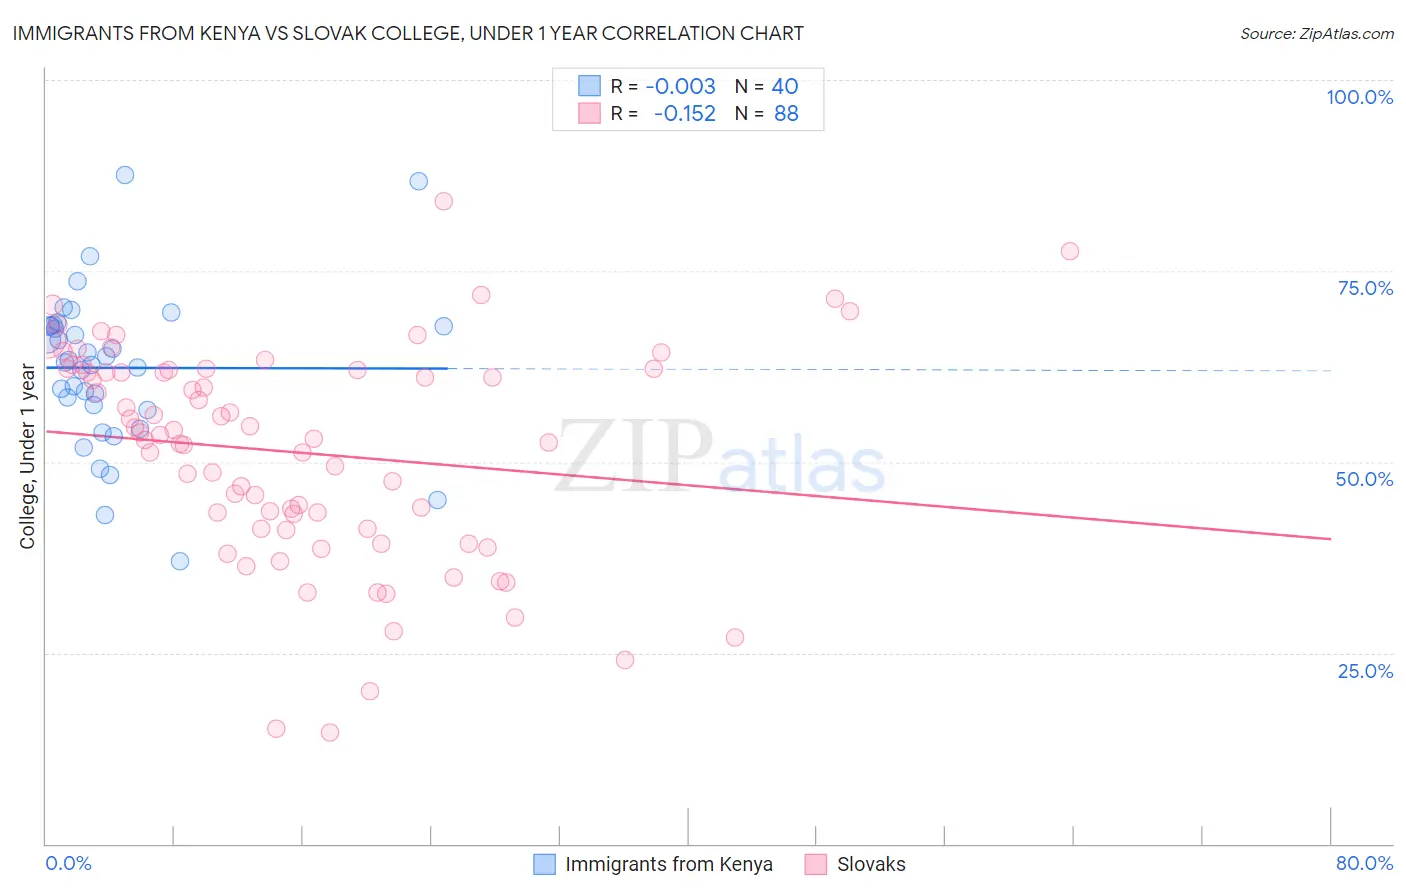
Immigrants from Kenya vs Slovak College, Under 1 year Correlation Chart
The statistical analysis conducted on geographies consisting of 218,085,582 people shows no correlation between the proportion of Immigrants from Kenya and percentage of population with at least college, under 1 year education in the United States with a correlation coefficient (R) of -0.003 and weighted average of 66.5%. Similarly, the statistical analysis conducted on geographies consisting of 397,891,856 people shows a poor negative correlation between the proportion of Slovaks and percentage of population with at least college, under 1 year education in the United States with a correlation coefficient (R) of -0.152 and weighted average of 64.7%, a difference of 2.8%.
College, Under 1 year Correlation Summary
| Measurement | Immigrants from Kenya | Slovak |
| Minimum | 37.0% | 14.5% |
| Maximum | 87.6% | 84.1% |
| Range | 50.6% | 69.5% |
| Mean | 62.3% | 51.3% |
| Median | 63.2% | 53.3% |
| Interquartile 25% (IQ1) | 57.1% | 41.2% |
| Interquartile 75% (IQ3) | 67.8% | 62.0% |
| Interquartile Range (IQR) | 10.7% | 20.8% |
| Standard Deviation (Sample) | 10.3% | 14.1% |
| Standard Deviation (Population) | 10.1% | 14.0% |
Similar Demographics by College, Under 1 year
Demographics Similar to Immigrants from Kenya by College, Under 1 year
In terms of college, under 1 year, the demographic groups most similar to Immigrants from Kenya are Kenyan (66.5%, a difference of 0.0%), Immigrants from Germany (66.5%, a difference of 0.010%), Immigrants from Morocco (66.5%, a difference of 0.010%), Immigrants from Uganda (66.5%, a difference of 0.070%), and English (66.6%, a difference of 0.090%).
| Demographics | Rating | Rank | College, Under 1 year |
| Immigrants | Italy | 86.9 /100 | #138 | Excellent 66.8% |
| Venezuelans | 85.9 /100 | #139 | Excellent 66.7% |
| Slavs | 85.9 /100 | #140 | Excellent 66.7% |
| Immigrants | Afghanistan | 85.1 /100 | #141 | Excellent 66.7% |
| English | 82.9 /100 | #142 | Excellent 66.6% |
| Immigrants | Uganda | 82.8 /100 | #143 | Excellent 66.5% |
| Immigrants | Germany | 82.0 /100 | #144 | Excellent 66.5% |
| Immigrants | Kenya | 81.8 /100 | #145 | Excellent 66.5% |
| Kenyans | 81.7 /100 | #146 | Excellent 66.5% |
| Immigrants | Morocco | 81.7 /100 | #147 | Excellent 66.5% |
| Taiwanese | 78.6 /100 | #148 | Good 66.4% |
| Immigrants | Venezuela | 77.9 /100 | #149 | Good 66.3% |
| Immigrants | Iraq | 77.1 /100 | #150 | Good 66.3% |
| Immigrants | Sudan | 76.0 /100 | #151 | Good 66.2% |
| Sudanese | 74.1 /100 | #152 | Good 66.2% |
Demographics Similar to Slovaks by College, Under 1 year
In terms of college, under 1 year, the demographic groups most similar to Slovaks are Immigrants from Thailand (64.7%, a difference of 0.020%), Immigrants from Armenia (64.7%, a difference of 0.070%), Immigrants from Cameroon (64.6%, a difference of 0.13%), Immigrants from Philippines (64.8%, a difference of 0.19%), and Spanish (64.9%, a difference of 0.26%).
| Demographics | Rating | Rank | College, Under 1 year |
| Immigrants | Sierra Leone | 39.7 /100 | #186 | Fair 65.1% |
| Immigrants | Southern Europe | 34.3 /100 | #187 | Fair 64.9% |
| Immigrants | Albania | 32.0 /100 | #188 | Fair 64.9% |
| Spanish | 31.6 /100 | #189 | Fair 64.9% |
| Immigrants | Philippines | 30.1 /100 | #190 | Fair 64.8% |
| Immigrants | Armenia | 28.1 /100 | #191 | Fair 64.7% |
| Immigrants | Thailand | 27.0 /100 | #192 | Fair 64.7% |
| Slovaks | 26.7 /100 | #193 | Fair 64.7% |
| Immigrants | Cameroon | 24.6 /100 | #194 | Fair 64.6% |
| Immigrants | South Eastern Asia | 22.1 /100 | #195 | Fair 64.5% |
| Tongans | 21.2 /100 | #196 | Fair 64.5% |
| Costa Ricans | 19.6 /100 | #197 | Poor 64.4% |
| Tsimshian | 17.9 /100 | #198 | Poor 64.3% |
| Panamanians | 17.0 /100 | #199 | Poor 64.3% |
| Nigerians | 16.7 /100 | #200 | Poor 64.3% |