Bahamian vs Immigrants from Cambodia 4th Grade
COMPARE
Bahamian
Immigrants from Cambodia
4th Grade
4th Grade Comparison
Bahamians
Immigrants from Cambodia
97.2%
4TH GRADE
3.8/ 100
METRIC RATING
226th/ 347
METRIC RANK
95.8%
4TH GRADE
0.0/ 100
METRIC RATING
329th/ 347
METRIC RANK
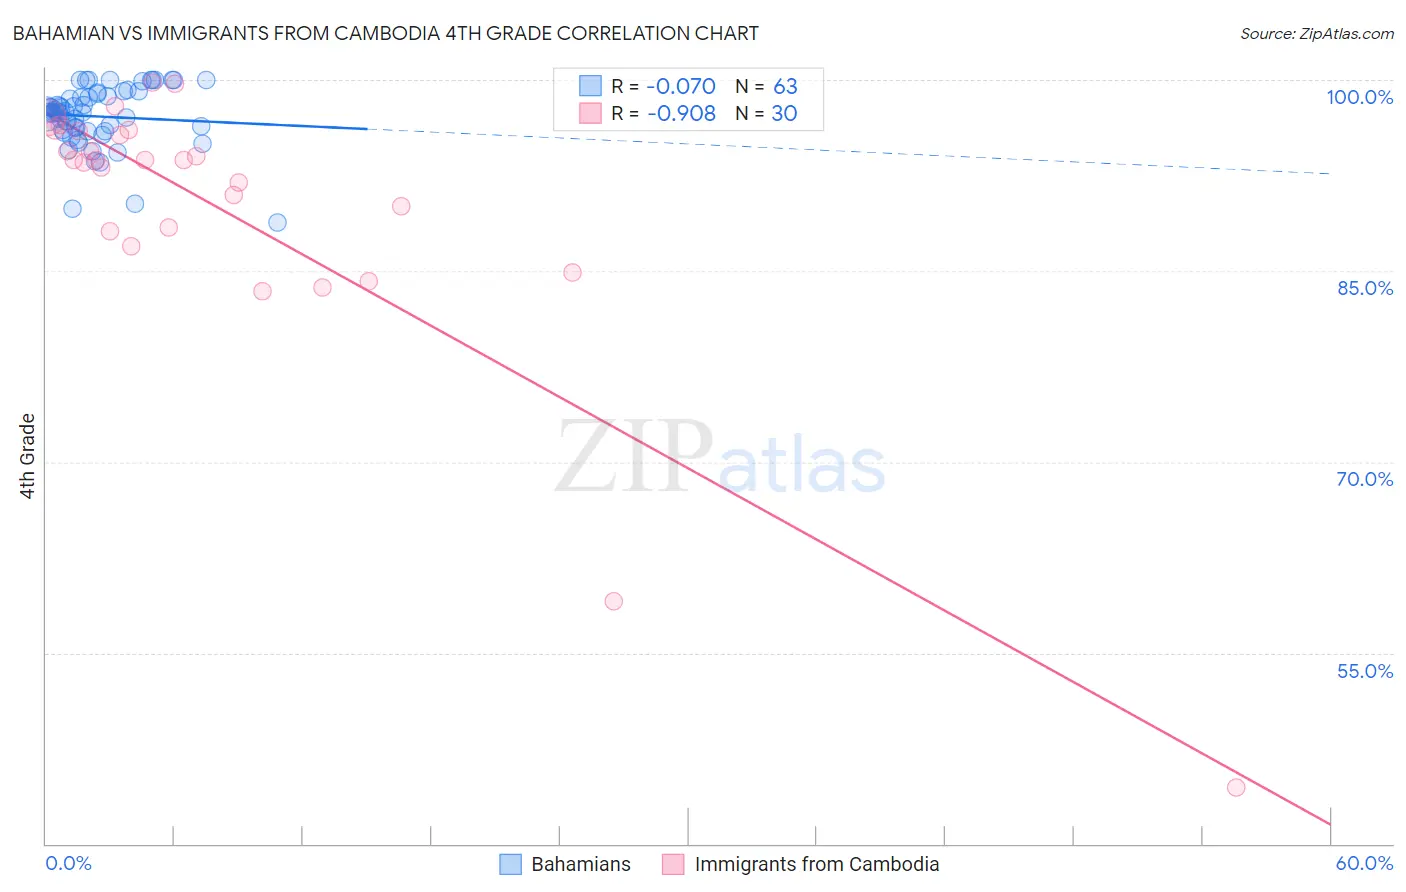
Bahamian vs Immigrants from Cambodia 4th Grade Correlation Chart
The statistical analysis conducted on geographies consisting of 112,698,819 people shows a slight negative correlation between the proportion of Bahamians and percentage of population with at least 4th grade education in the United States with a correlation coefficient (R) of -0.070 and weighted average of 97.2%. Similarly, the statistical analysis conducted on geographies consisting of 205,153,442 people shows a near-perfect negative correlation between the proportion of Immigrants from Cambodia and percentage of population with at least 4th grade education in the United States with a correlation coefficient (R) of -0.908 and weighted average of 95.8%, a difference of 1.5%.
4th Grade Correlation Summary
| Measurement | Bahamian | Immigrants from Cambodia |
| Minimum | 88.8% | 44.4% |
| Maximum | 100.0% | 99.8% |
| Range | 11.2% | 55.4% |
| Mean | 97.1% | 89.8% |
| Median | 97.4% | 93.7% |
| Interquartile 25% (IQ1) | 96.0% | 88.2% |
| Interquartile 75% (IQ3) | 98.9% | 96.0% |
| Interquartile Range (IQR) | 2.9% | 7.8% |
| Standard Deviation (Sample) | 2.4% | 11.5% |
| Standard Deviation (Population) | 2.4% | 11.3% |
Similar Demographics by 4th Grade
Demographics Similar to Bahamians by 4th Grade
In terms of 4th grade, the demographic groups most similar to Bahamians are Immigrants from Pakistan (97.2%, a difference of 0.0%), Subsaharan African (97.2%, a difference of 0.010%), Liberian (97.2%, a difference of 0.010%), Uruguayan (97.2%, a difference of 0.010%), and Immigrants from Malaysia (97.2%, a difference of 0.010%).
| Demographics | Rating | Rank | 4th Grade |
| Tongans | 5.8 /100 | #219 | Tragic 97.3% |
| South American Indians | 5.5 /100 | #220 | Tragic 97.3% |
| Immigrants | Panama | 5.4 /100 | #221 | Tragic 97.3% |
| Immigrants | Lebanon | 5.1 /100 | #222 | Tragic 97.3% |
| Immigrants | Sudan | 5.0 /100 | #223 | Tragic 97.2% |
| Immigrants | Syria | 5.0 /100 | #224 | Tragic 97.2% |
| Immigrants | Iraq | 4.6 /100 | #225 | Tragic 97.2% |
| Bahamians | 3.8 /100 | #226 | Tragic 97.2% |
| Immigrants | Pakistan | 3.7 /100 | #227 | Tragic 97.2% |
| Sub-Saharan Africans | 3.6 /100 | #228 | Tragic 97.2% |
| Liberians | 3.6 /100 | #229 | Tragic 97.2% |
| Uruguayans | 3.5 /100 | #230 | Tragic 97.2% |
| Immigrants | Malaysia | 3.4 /100 | #231 | Tragic 97.2% |
| Immigrants | Western Asia | 3.4 /100 | #232 | Tragic 97.2% |
| Senegalese | 3.1 /100 | #233 | Tragic 97.2% |
Demographics Similar to Immigrants from Cambodia by 4th Grade
In terms of 4th grade, the demographic groups most similar to Immigrants from Cambodia are Immigrants from Fiji (95.8%, a difference of 0.0%), Mexican American Indian (95.8%, a difference of 0.010%), Immigrants from Armenia (95.8%, a difference of 0.050%), Immigrants from Honduras (95.8%, a difference of 0.060%), and Immigrants from Dominican Republic (95.7%, a difference of 0.11%).
| Demographics | Rating | Rank | 4th Grade |
| Immigrants | Vietnam | 0.0 /100 | #322 | Tragic 96.0% |
| Immigrants | Nicaragua | 0.0 /100 | #323 | Tragic 96.0% |
| Immigrants | Belize | 0.0 /100 | #324 | Tragic 96.0% |
| Dominicans | 0.0 /100 | #325 | Tragic 96.0% |
| Hispanics or Latinos | 0.0 /100 | #326 | Tragic 96.0% |
| Hondurans | 0.0 /100 | #327 | Tragic 96.0% |
| Mexican American Indians | 0.0 /100 | #328 | Tragic 95.8% |
| Immigrants | Cambodia | 0.0 /100 | #329 | Tragic 95.8% |
| Immigrants | Fiji | 0.0 /100 | #330 | Tragic 95.8% |
| Immigrants | Armenia | 0.0 /100 | #331 | Tragic 95.8% |
| Immigrants | Honduras | 0.0 /100 | #332 | Tragic 95.8% |
| Immigrants | Dominican Republic | 0.0 /100 | #333 | Tragic 95.7% |
| Immigrants | Cabo Verde | 0.0 /100 | #334 | Tragic 95.7% |
| Immigrants | Latin America | 0.0 /100 | #335 | Tragic 95.7% |
| Mexicans | 0.0 /100 | #336 | Tragic 95.6% |