West Indian vs Immigrants from Cambodia 4th Grade
COMPARE
West Indian
Immigrants from Cambodia
4th Grade
4th Grade Comparison
West Indians
Immigrants from Cambodia
97.0%
4TH GRADE
0.4/ 100
METRIC RATING
262nd/ 347
METRIC RANK
95.8%
4TH GRADE
0.0/ 100
METRIC RATING
329th/ 347
METRIC RANK
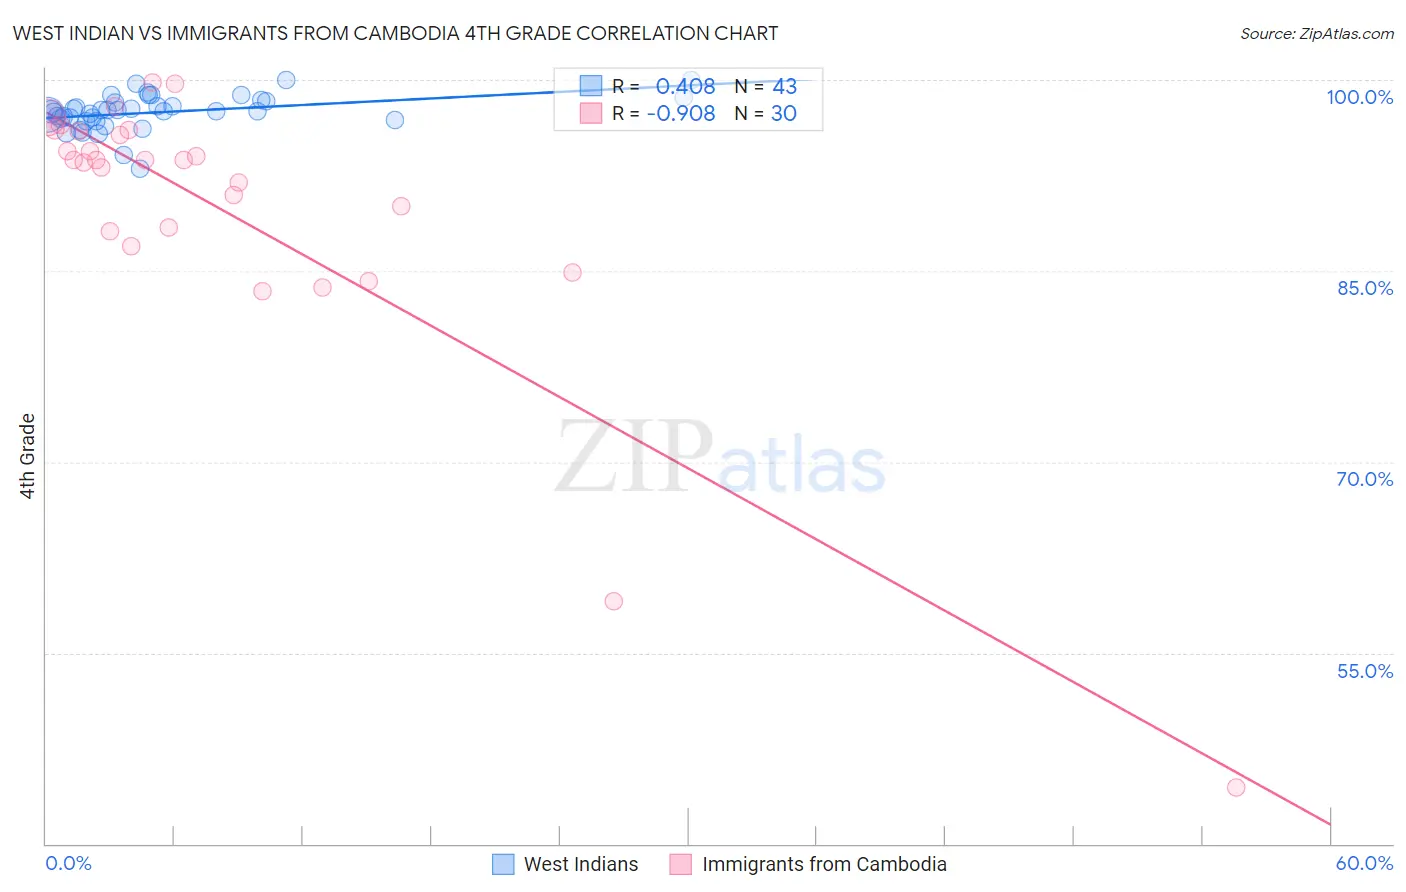
West Indian vs Immigrants from Cambodia 4th Grade Correlation Chart
The statistical analysis conducted on geographies consisting of 254,059,006 people shows a moderate positive correlation between the proportion of West Indians and percentage of population with at least 4th grade education in the United States with a correlation coefficient (R) of 0.408 and weighted average of 97.0%. Similarly, the statistical analysis conducted on geographies consisting of 205,153,442 people shows a near-perfect negative correlation between the proportion of Immigrants from Cambodia and percentage of population with at least 4th grade education in the United States with a correlation coefficient (R) of -0.908 and weighted average of 95.8%, a difference of 1.2%.
4th Grade Correlation Summary
| Measurement | West Indian | Immigrants from Cambodia |
| Minimum | 93.0% | 44.4% |
| Maximum | 100.0% | 99.8% |
| Range | 7.0% | 55.4% |
| Mean | 97.5% | 89.8% |
| Median | 97.5% | 93.7% |
| Interquartile 25% (IQ1) | 96.8% | 88.2% |
| Interquartile 75% (IQ3) | 98.4% | 96.0% |
| Interquartile Range (IQR) | 1.5% | 7.8% |
| Standard Deviation (Sample) | 1.4% | 11.5% |
| Standard Deviation (Population) | 1.4% | 11.3% |
Similar Demographics by 4th Grade
Demographics Similar to West Indians by 4th Grade
In terms of 4th grade, the demographic groups most similar to West Indians are Immigrants from Jamaica (97.0%, a difference of 0.0%), Immigrants from Sierra Leone (97.0%, a difference of 0.010%), Immigrants from South America (97.0%, a difference of 0.010%), Taiwanese (97.0%, a difference of 0.010%), and Immigrants from Ethiopia (97.0%, a difference of 0.020%).
| Demographics | Rating | Rank | 4th Grade |
| Peruvians | 0.7 /100 | #255 | Tragic 97.1% |
| Bolivians | 0.7 /100 | #256 | Tragic 97.1% |
| Immigrants | Congo | 0.5 /100 | #257 | Tragic 97.0% |
| Immigrants | Colombia | 0.5 /100 | #258 | Tragic 97.0% |
| Immigrants | Ethiopia | 0.4 /100 | #259 | Tragic 97.0% |
| Immigrants | Sierra Leone | 0.4 /100 | #260 | Tragic 97.0% |
| Immigrants | South America | 0.4 /100 | #261 | Tragic 97.0% |
| West Indians | 0.4 /100 | #262 | Tragic 97.0% |
| Immigrants | Jamaica | 0.3 /100 | #263 | Tragic 97.0% |
| Taiwanese | 0.3 /100 | #264 | Tragic 97.0% |
| Armenians | 0.3 /100 | #265 | Tragic 97.0% |
| Immigrants | China | 0.3 /100 | #266 | Tragic 97.0% |
| Immigrants | Nigeria | 0.3 /100 | #267 | Tragic 97.0% |
| Ghanaians | 0.2 /100 | #268 | Tragic 97.0% |
| Immigrants | Uzbekistan | 0.2 /100 | #269 | Tragic 96.9% |
Demographics Similar to Immigrants from Cambodia by 4th Grade
In terms of 4th grade, the demographic groups most similar to Immigrants from Cambodia are Immigrants from Fiji (95.8%, a difference of 0.0%), Mexican American Indian (95.8%, a difference of 0.010%), Immigrants from Armenia (95.8%, a difference of 0.050%), Immigrants from Honduras (95.8%, a difference of 0.060%), and Immigrants from Dominican Republic (95.7%, a difference of 0.11%).
| Demographics | Rating | Rank | 4th Grade |
| Immigrants | Vietnam | 0.0 /100 | #322 | Tragic 96.0% |
| Immigrants | Nicaragua | 0.0 /100 | #323 | Tragic 96.0% |
| Immigrants | Belize | 0.0 /100 | #324 | Tragic 96.0% |
| Dominicans | 0.0 /100 | #325 | Tragic 96.0% |
| Hispanics or Latinos | 0.0 /100 | #326 | Tragic 96.0% |
| Hondurans | 0.0 /100 | #327 | Tragic 96.0% |
| Mexican American Indians | 0.0 /100 | #328 | Tragic 95.8% |
| Immigrants | Cambodia | 0.0 /100 | #329 | Tragic 95.8% |
| Immigrants | Fiji | 0.0 /100 | #330 | Tragic 95.8% |
| Immigrants | Armenia | 0.0 /100 | #331 | Tragic 95.8% |
| Immigrants | Honduras | 0.0 /100 | #332 | Tragic 95.8% |
| Immigrants | Dominican Republic | 0.0 /100 | #333 | Tragic 95.7% |
| Immigrants | Cabo Verde | 0.0 /100 | #334 | Tragic 95.7% |
| Immigrants | Latin America | 0.0 /100 | #335 | Tragic 95.7% |
| Mexicans | 0.0 /100 | #336 | Tragic 95.6% |