Hawaiian vs Immigrants from Cambodia 4th Grade
COMPARE
Hawaiian
Immigrants from Cambodia
4th Grade
4th Grade Comparison
Hawaiians
Immigrants from Cambodia
97.4%
4TH GRADE
25.6/ 100
METRIC RATING
197th/ 347
METRIC RANK
95.8%
4TH GRADE
0.0/ 100
METRIC RATING
329th/ 347
METRIC RANK
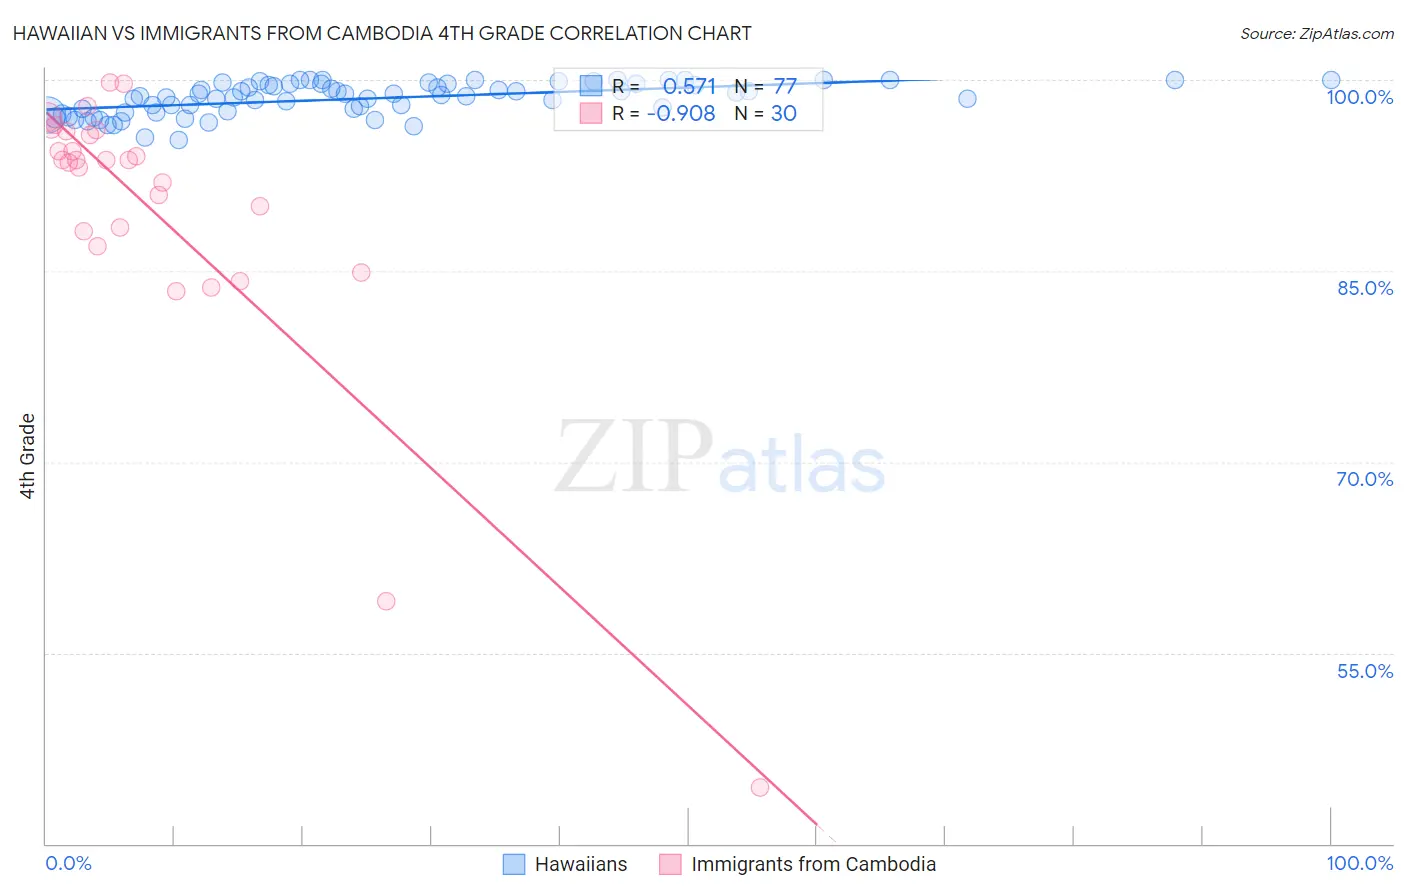
Hawaiian vs Immigrants from Cambodia 4th Grade Correlation Chart
The statistical analysis conducted on geographies consisting of 327,621,279 people shows a substantial positive correlation between the proportion of Hawaiians and percentage of population with at least 4th grade education in the United States with a correlation coefficient (R) of 0.571 and weighted average of 97.4%. Similarly, the statistical analysis conducted on geographies consisting of 205,153,442 people shows a near-perfect negative correlation between the proportion of Immigrants from Cambodia and percentage of population with at least 4th grade education in the United States with a correlation coefficient (R) of -0.908 and weighted average of 95.8%, a difference of 1.7%.
4th Grade Correlation Summary
| Measurement | Hawaiian | Immigrants from Cambodia |
| Minimum | 95.3% | 44.4% |
| Maximum | 100.0% | 99.8% |
| Range | 4.7% | 55.4% |
| Mean | 98.5% | 89.8% |
| Median | 98.7% | 93.7% |
| Interquartile 25% (IQ1) | 97.5% | 88.2% |
| Interquartile 75% (IQ3) | 99.7% | 96.0% |
| Interquartile Range (IQR) | 2.2% | 7.8% |
| Standard Deviation (Sample) | 1.2% | 11.5% |
| Standard Deviation (Population) | 1.2% | 11.3% |
Similar Demographics by 4th Grade
Demographics Similar to Hawaiians by 4th Grade
In terms of 4th grade, the demographic groups most similar to Hawaiians are Immigrants from Albania (97.4%, a difference of 0.010%), Guamanian/Chamorro (97.4%, a difference of 0.010%), Navajo (97.4%, a difference of 0.020%), Immigrants from Ukraine (97.4%, a difference of 0.020%), and Immigrants from Egypt (97.4%, a difference of 0.020%).
| Demographics | Rating | Rank | 4th Grade |
| Blacks/African Americans | 31.1 /100 | #190 | Fair 97.4% |
| Navajo | 30.7 /100 | #191 | Fair 97.4% |
| Immigrants | Ukraine | 30.1 /100 | #192 | Fair 97.4% |
| Immigrants | Egypt | 30.1 /100 | #193 | Fair 97.4% |
| Portuguese | 29.2 /100 | #194 | Fair 97.4% |
| Paraguayans | 28.9 /100 | #195 | Fair 97.4% |
| Immigrants | Albania | 27.7 /100 | #196 | Fair 97.4% |
| Hawaiians | 25.6 /100 | #197 | Fair 97.4% |
| Guamanians/Chamorros | 23.0 /100 | #198 | Fair 97.4% |
| Natives/Alaskans | 20.6 /100 | #199 | Fair 97.4% |
| Immigrants | Uganda | 19.8 /100 | #200 | Poor 97.4% |
| Immigrants | Southern Europe | 16.2 /100 | #201 | Poor 97.4% |
| Immigrants | Chile | 16.1 /100 | #202 | Poor 97.4% |
| Immigrants | Northern Africa | 15.1 /100 | #203 | Poor 97.4% |
| Africans | 14.6 /100 | #204 | Poor 97.4% |
Demographics Similar to Immigrants from Cambodia by 4th Grade
In terms of 4th grade, the demographic groups most similar to Immigrants from Cambodia are Immigrants from Fiji (95.8%, a difference of 0.0%), Mexican American Indian (95.8%, a difference of 0.010%), Immigrants from Armenia (95.8%, a difference of 0.050%), Immigrants from Honduras (95.8%, a difference of 0.060%), and Immigrants from Dominican Republic (95.7%, a difference of 0.11%).
| Demographics | Rating | Rank | 4th Grade |
| Immigrants | Vietnam | 0.0 /100 | #322 | Tragic 96.0% |
| Immigrants | Nicaragua | 0.0 /100 | #323 | Tragic 96.0% |
| Immigrants | Belize | 0.0 /100 | #324 | Tragic 96.0% |
| Dominicans | 0.0 /100 | #325 | Tragic 96.0% |
| Hispanics or Latinos | 0.0 /100 | #326 | Tragic 96.0% |
| Hondurans | 0.0 /100 | #327 | Tragic 96.0% |
| Mexican American Indians | 0.0 /100 | #328 | Tragic 95.8% |
| Immigrants | Cambodia | 0.0 /100 | #329 | Tragic 95.8% |
| Immigrants | Fiji | 0.0 /100 | #330 | Tragic 95.8% |
| Immigrants | Armenia | 0.0 /100 | #331 | Tragic 95.8% |
| Immigrants | Honduras | 0.0 /100 | #332 | Tragic 95.8% |
| Immigrants | Dominican Republic | 0.0 /100 | #333 | Tragic 95.7% |
| Immigrants | Cabo Verde | 0.0 /100 | #334 | Tragic 95.7% |
| Immigrants | Latin America | 0.0 /100 | #335 | Tragic 95.7% |
| Mexicans | 0.0 /100 | #336 | Tragic 95.6% |