Tohono O'odham vs Immigrants from Cambodia 4th Grade
COMPARE
Tohono O'odham
Immigrants from Cambodia
4th Grade
4th Grade Comparison
Tohono O'odham
Immigrants from Cambodia
97.3%
4TH GRADE
8.4/ 100
METRIC RATING
212th/ 347
METRIC RANK
95.8%
4TH GRADE
0.0/ 100
METRIC RATING
329th/ 347
METRIC RANK
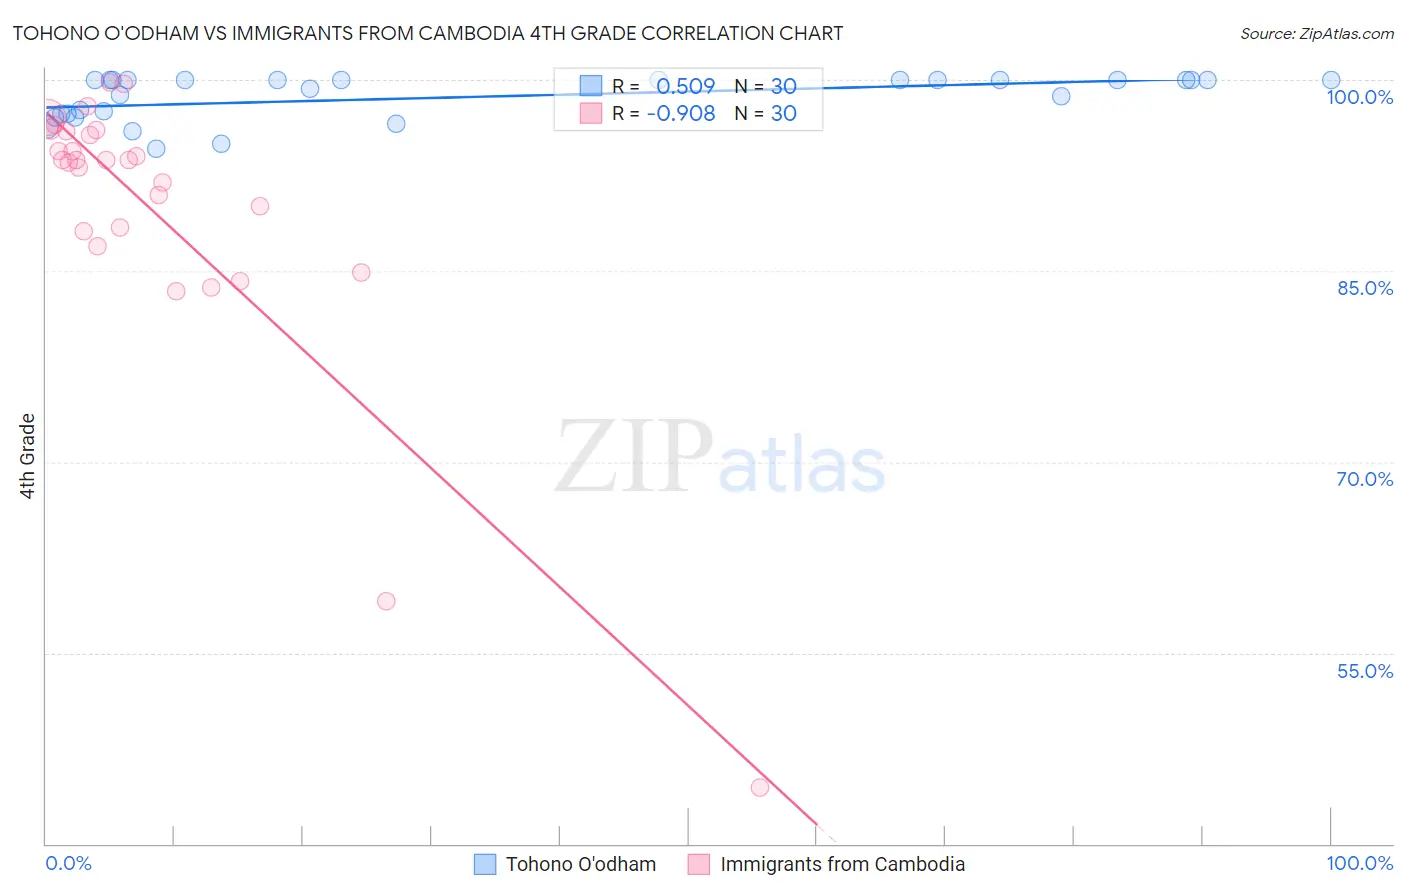
Tohono O'odham vs Immigrants from Cambodia 4th Grade Correlation Chart
The statistical analysis conducted on geographies consisting of 58,723,100 people shows a substantial positive correlation between the proportion of Tohono O'odham and percentage of population with at least 4th grade education in the United States with a correlation coefficient (R) of 0.509 and weighted average of 97.3%. Similarly, the statistical analysis conducted on geographies consisting of 205,153,442 people shows a near-perfect negative correlation between the proportion of Immigrants from Cambodia and percentage of population with at least 4th grade education in the United States with a correlation coefficient (R) of -0.908 and weighted average of 95.8%, a difference of 1.5%.
4th Grade Correlation Summary
| Measurement | Tohono O'odham | Immigrants from Cambodia |
| Minimum | 94.6% | 44.4% |
| Maximum | 100.0% | 99.8% |
| Range | 5.4% | 55.4% |
| Mean | 98.6% | 89.8% |
| Median | 100.0% | 93.7% |
| Interquartile 25% (IQ1) | 97.3% | 88.2% |
| Interquartile 75% (IQ3) | 100.0% | 96.0% |
| Interquartile Range (IQR) | 2.7% | 7.8% |
| Standard Deviation (Sample) | 1.7% | 11.5% |
| Standard Deviation (Population) | 1.7% | 11.3% |
Similar Demographics by 4th Grade
Demographics Similar to Tohono O'odham by 4th Grade
In terms of 4th grade, the demographic groups most similar to Tohono O'odham are Costa Rican (97.3%, a difference of 0.0%), Laotian (97.3%, a difference of 0.010%), Immigrants from Oceania (97.3%, a difference of 0.010%), Sudanese (97.3%, a difference of 0.010%), and Immigrants from Nepal (97.3%, a difference of 0.010%).
| Demographics | Rating | Rank | 4th Grade |
| Paiute | 13.2 /100 | #205 | Poor 97.3% |
| Immigrants | Zaire | 12.8 /100 | #206 | Poor 97.3% |
| Moroccans | 11.3 /100 | #207 | Poor 97.3% |
| Immigrants | Bahamas | 10.8 /100 | #208 | Poor 97.3% |
| Laotians | 9.3 /100 | #209 | Tragic 97.3% |
| Immigrants | Oceania | 9.1 /100 | #210 | Tragic 97.3% |
| Sudanese | 9.0 /100 | #211 | Tragic 97.3% |
| Tohono O'odham | 8.4 /100 | #212 | Tragic 97.3% |
| Costa Ricans | 8.3 /100 | #213 | Tragic 97.3% |
| Immigrants | Nepal | 7.7 /100 | #214 | Tragic 97.3% |
| Immigrants | Morocco | 7.1 /100 | #215 | Tragic 97.3% |
| Samoans | 6.8 /100 | #216 | Tragic 97.3% |
| Sierra Leoneans | 6.5 /100 | #217 | Tragic 97.3% |
| Iraqis | 6.3 /100 | #218 | Tragic 97.3% |
| Tongans | 5.8 /100 | #219 | Tragic 97.3% |
Demographics Similar to Immigrants from Cambodia by 4th Grade
In terms of 4th grade, the demographic groups most similar to Immigrants from Cambodia are Immigrants from Fiji (95.8%, a difference of 0.0%), Mexican American Indian (95.8%, a difference of 0.010%), Immigrants from Armenia (95.8%, a difference of 0.050%), Immigrants from Honduras (95.8%, a difference of 0.060%), and Immigrants from Dominican Republic (95.7%, a difference of 0.11%).
| Demographics | Rating | Rank | 4th Grade |
| Immigrants | Vietnam | 0.0 /100 | #322 | Tragic 96.0% |
| Immigrants | Nicaragua | 0.0 /100 | #323 | Tragic 96.0% |
| Immigrants | Belize | 0.0 /100 | #324 | Tragic 96.0% |
| Dominicans | 0.0 /100 | #325 | Tragic 96.0% |
| Hispanics or Latinos | 0.0 /100 | #326 | Tragic 96.0% |
| Hondurans | 0.0 /100 | #327 | Tragic 96.0% |
| Mexican American Indians | 0.0 /100 | #328 | Tragic 95.8% |
| Immigrants | Cambodia | 0.0 /100 | #329 | Tragic 95.8% |
| Immigrants | Fiji | 0.0 /100 | #330 | Tragic 95.8% |
| Immigrants | Armenia | 0.0 /100 | #331 | Tragic 95.8% |
| Immigrants | Honduras | 0.0 /100 | #332 | Tragic 95.8% |
| Immigrants | Dominican Republic | 0.0 /100 | #333 | Tragic 95.7% |
| Immigrants | Cabo Verde | 0.0 /100 | #334 | Tragic 95.7% |
| Immigrants | Latin America | 0.0 /100 | #335 | Tragic 95.7% |
| Mexicans | 0.0 /100 | #336 | Tragic 95.6% |