Spaniard vs Immigrants from Fiji 8th Grade
COMPARE
Spaniard
Immigrants from Fiji
8th Grade
8th Grade Comparison
Spaniards
Immigrants from Fiji
95.8%
8TH GRADE
60.0/ 100
METRIC RATING
167th/ 347
METRIC RANK
93.2%
8TH GRADE
0.0/ 100
METRIC RATING
320th/ 347
METRIC RANK
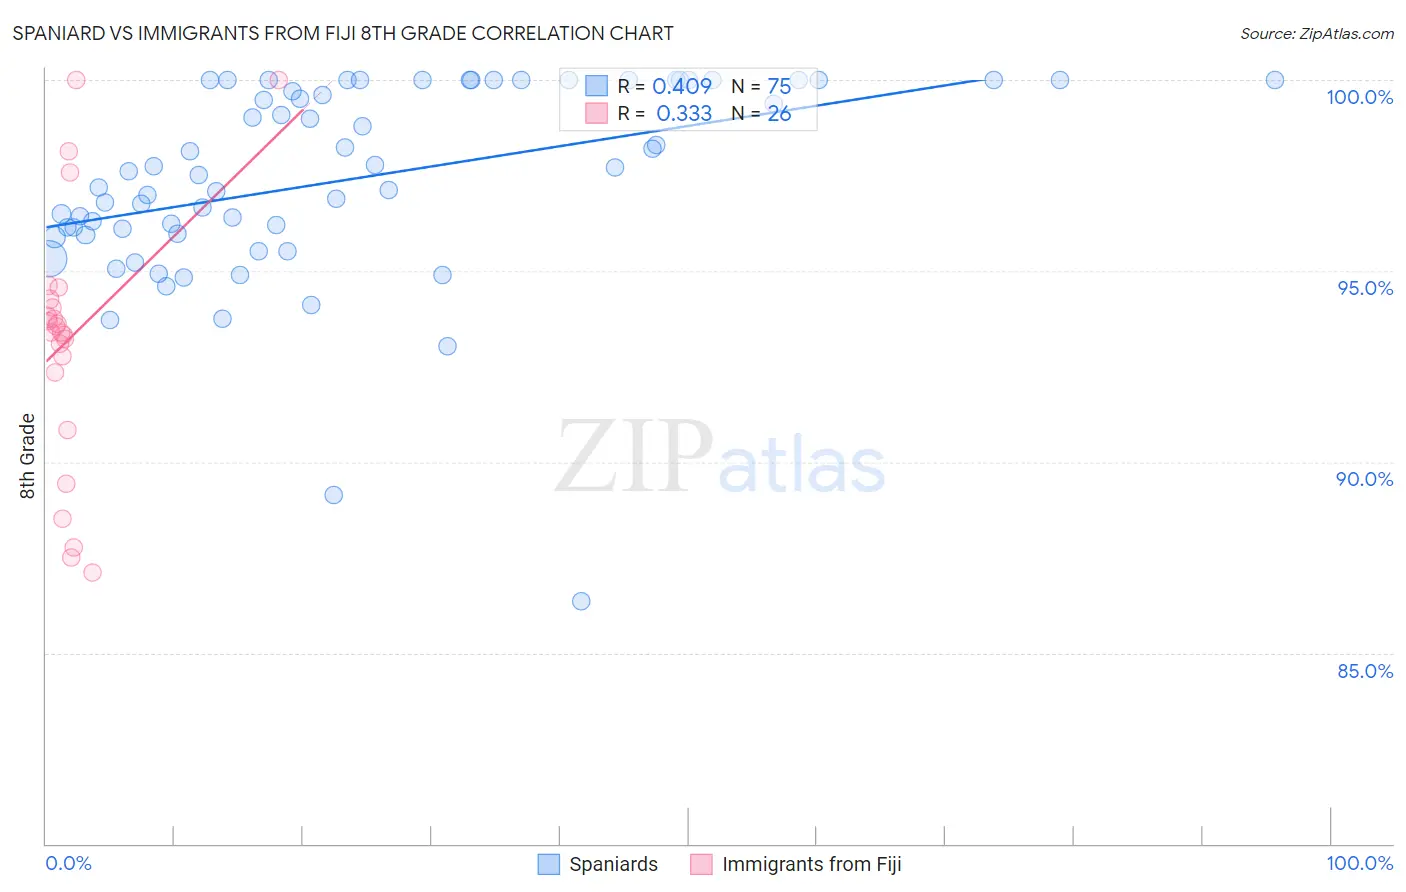
Spaniard vs Immigrants from Fiji 8th Grade Correlation Chart
The statistical analysis conducted on geographies consisting of 443,544,503 people shows a moderate positive correlation between the proportion of Spaniards and percentage of population with at least 8th grade education in the United States with a correlation coefficient (R) of 0.409 and weighted average of 95.8%. Similarly, the statistical analysis conducted on geographies consisting of 93,756,204 people shows a mild positive correlation between the proportion of Immigrants from Fiji and percentage of population with at least 8th grade education in the United States with a correlation coefficient (R) of 0.333 and weighted average of 93.2%, a difference of 2.8%.
8th Grade Correlation Summary
| Measurement | Spaniard | Immigrants from Fiji |
| Minimum | 86.4% | 87.1% |
| Maximum | 100.0% | 100.0% |
| Range | 13.6% | 12.9% |
| Mean | 97.4% | 93.2% |
| Median | 97.6% | 93.5% |
| Interquartile 25% (IQ1) | 96.0% | 92.4% |
| Interquartile 75% (IQ3) | 100.0% | 94.3% |
| Interquartile Range (IQR) | 4.0% | 1.9% |
| Standard Deviation (Sample) | 2.6% | 3.4% |
| Standard Deviation (Population) | 2.6% | 3.3% |
Similar Demographics by 8th Grade
Demographics Similar to Spaniards by 8th Grade
In terms of 8th grade, the demographic groups most similar to Spaniards are Immigrants from Ukraine (95.8%, a difference of 0.0%), Alsatian (95.8%, a difference of 0.010%), Immigrants from Poland (95.8%, a difference of 0.010%), Immigrants from Iran (95.8%, a difference of 0.010%), and Ute (95.8%, a difference of 0.010%).
| Demographics | Rating | Rank | 8th Grade |
| Seminole | 67.7 /100 | #160 | Good 95.8% |
| Bermudans | 67.5 /100 | #161 | Good 95.8% |
| Immigrants | Kenya | 67.2 /100 | #162 | Good 95.8% |
| Immigrants | Sri Lanka | 64.1 /100 | #163 | Good 95.8% |
| Immigrants | Italy | 63.5 /100 | #164 | Good 95.8% |
| Alsatians | 61.4 /100 | #165 | Good 95.8% |
| Immigrants | Poland | 61.1 /100 | #166 | Good 95.8% |
| Spaniards | 60.0 /100 | #167 | Good 95.8% |
| Immigrants | Ukraine | 59.5 /100 | #168 | Average 95.8% |
| Immigrants | Iran | 58.6 /100 | #169 | Average 95.8% |
| Ute | 58.5 /100 | #170 | Average 95.8% |
| Egyptians | 58.2 /100 | #171 | Average 95.8% |
| Immigrants | Korea | 57.9 /100 | #172 | Average 95.8% |
| Mongolians | 53.0 /100 | #173 | Average 95.8% |
| Chileans | 50.0 /100 | #174 | Average 95.7% |
Demographics Similar to Immigrants from Fiji by 8th Grade
In terms of 8th grade, the demographic groups most similar to Immigrants from Fiji are Immigrants from Cuba (93.2%, a difference of 0.030%), Puerto Rican (93.2%, a difference of 0.060%), Immigrants from Ecuador (93.3%, a difference of 0.070%), Immigrants from Cambodia (93.3%, a difference of 0.12%), and Belizean (93.1%, a difference of 0.13%).
| Demographics | Rating | Rank | 8th Grade |
| Immigrants | Caribbean | 0.0 /100 | #313 | Tragic 93.5% |
| Immigrants | Vietnam | 0.0 /100 | #314 | Tragic 93.5% |
| Vietnamese | 0.0 /100 | #315 | Tragic 93.5% |
| Immigrants | Cambodia | 0.0 /100 | #316 | Tragic 93.3% |
| Immigrants | Ecuador | 0.0 /100 | #317 | Tragic 93.3% |
| Puerto Ricans | 0.0 /100 | #318 | Tragic 93.2% |
| Immigrants | Cuba | 0.0 /100 | #319 | Tragic 93.2% |
| Immigrants | Fiji | 0.0 /100 | #320 | Tragic 93.2% |
| Belizeans | 0.0 /100 | #321 | Tragic 93.1% |
| Nicaraguans | 0.0 /100 | #322 | Tragic 93.0% |
| Immigrants | Belize | 0.0 /100 | #323 | Tragic 92.9% |
| Nepalese | 0.0 /100 | #324 | Tragic 92.8% |
| Dominicans | 0.0 /100 | #325 | Tragic 92.8% |
| Central American Indians | 0.0 /100 | #326 | Tragic 92.7% |
| Immigrants | Azores | 0.0 /100 | #327 | Tragic 92.5% |