Spaniard vs Central American Indian 8th Grade
COMPARE
Spaniard
Central American Indian
8th Grade
8th Grade Comparison
Spaniards
Central American Indians
95.8%
8TH GRADE
60.0/ 100
METRIC RATING
167th/ 347
METRIC RANK
92.7%
8TH GRADE
0.0/ 100
METRIC RATING
326th/ 347
METRIC RANK
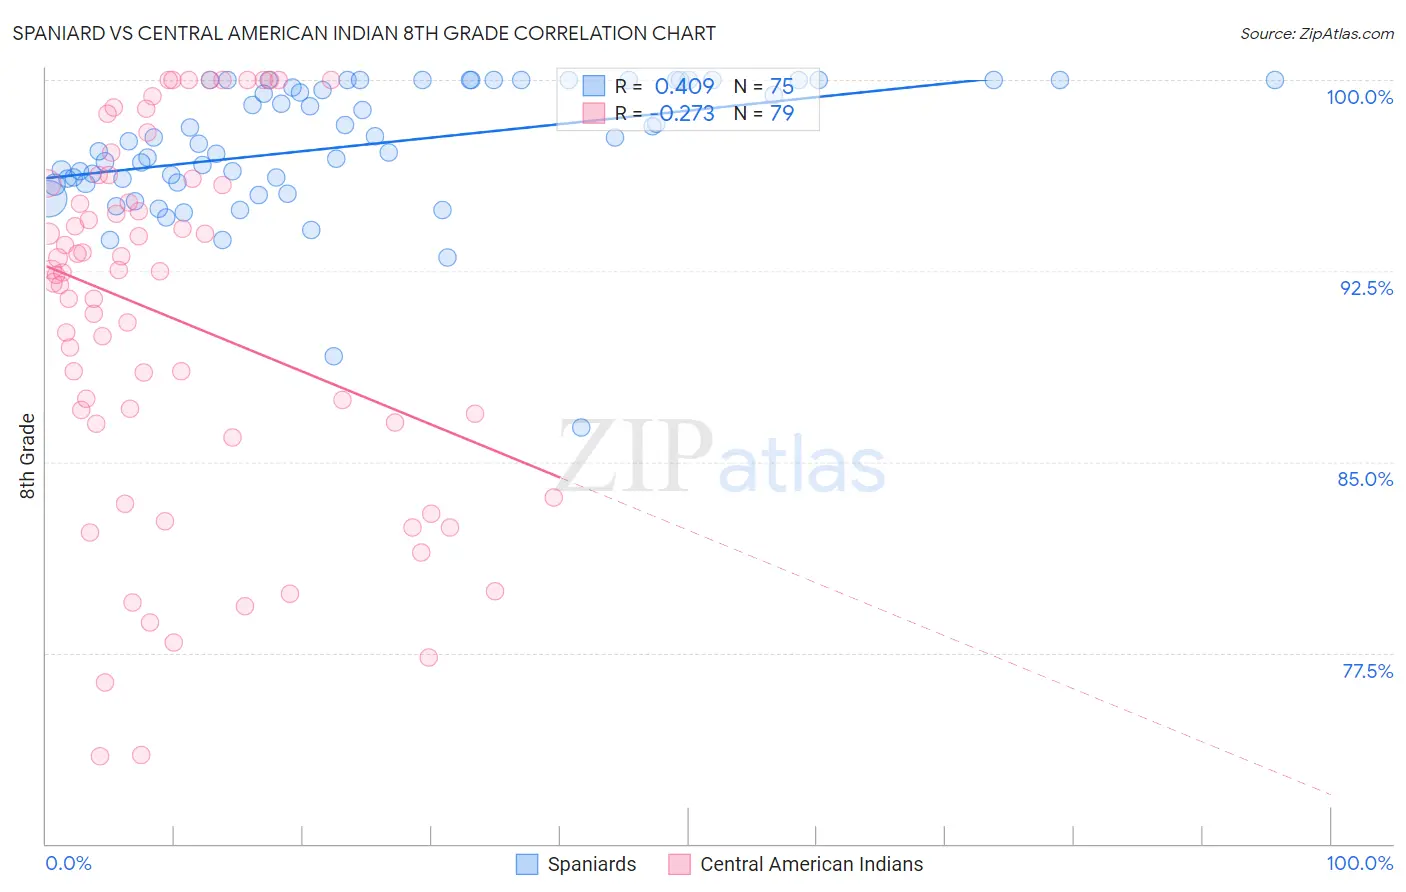
Spaniard vs Central American Indian 8th Grade Correlation Chart
The statistical analysis conducted on geographies consisting of 443,544,503 people shows a moderate positive correlation between the proportion of Spaniards and percentage of population with at least 8th grade education in the United States with a correlation coefficient (R) of 0.409 and weighted average of 95.8%. Similarly, the statistical analysis conducted on geographies consisting of 326,142,643 people shows a weak negative correlation between the proportion of Central American Indians and percentage of population with at least 8th grade education in the United States with a correlation coefficient (R) of -0.273 and weighted average of 92.7%, a difference of 3.3%.
8th Grade Correlation Summary
| Measurement | Spaniard | Central American Indian |
| Minimum | 86.4% | 73.4% |
| Maximum | 100.0% | 100.0% |
| Range | 13.6% | 26.6% |
| Mean | 97.4% | 90.6% |
| Median | 97.6% | 92.4% |
| Interquartile 25% (IQ1) | 96.0% | 86.5% |
| Interquartile 75% (IQ3) | 100.0% | 95.9% |
| Interquartile Range (IQR) | 4.0% | 9.5% |
| Standard Deviation (Sample) | 2.6% | 7.2% |
| Standard Deviation (Population) | 2.6% | 7.1% |
Similar Demographics by 8th Grade
Demographics Similar to Spaniards by 8th Grade
In terms of 8th grade, the demographic groups most similar to Spaniards are Immigrants from Ukraine (95.8%, a difference of 0.0%), Alsatian (95.8%, a difference of 0.010%), Immigrants from Poland (95.8%, a difference of 0.010%), Immigrants from Iran (95.8%, a difference of 0.010%), and Ute (95.8%, a difference of 0.010%).
| Demographics | Rating | Rank | 8th Grade |
| Seminole | 67.7 /100 | #160 | Good 95.8% |
| Bermudans | 67.5 /100 | #161 | Good 95.8% |
| Immigrants | Kenya | 67.2 /100 | #162 | Good 95.8% |
| Immigrants | Sri Lanka | 64.1 /100 | #163 | Good 95.8% |
| Immigrants | Italy | 63.5 /100 | #164 | Good 95.8% |
| Alsatians | 61.4 /100 | #165 | Good 95.8% |
| Immigrants | Poland | 61.1 /100 | #166 | Good 95.8% |
| Spaniards | 60.0 /100 | #167 | Good 95.8% |
| Immigrants | Ukraine | 59.5 /100 | #168 | Average 95.8% |
| Immigrants | Iran | 58.6 /100 | #169 | Average 95.8% |
| Ute | 58.5 /100 | #170 | Average 95.8% |
| Egyptians | 58.2 /100 | #171 | Average 95.8% |
| Immigrants | Korea | 57.9 /100 | #172 | Average 95.8% |
| Mongolians | 53.0 /100 | #173 | Average 95.8% |
| Chileans | 50.0 /100 | #174 | Average 95.7% |
Demographics Similar to Central American Indians by 8th Grade
In terms of 8th grade, the demographic groups most similar to Central American Indians are Dominican (92.8%, a difference of 0.050%), Nepalese (92.8%, a difference of 0.14%), Immigrants from Belize (92.9%, a difference of 0.21%), Immigrants from the Azores (92.5%, a difference of 0.25%), and Nicaraguan (93.0%, a difference of 0.26%).
| Demographics | Rating | Rank | 8th Grade |
| Immigrants | Cuba | 0.0 /100 | #319 | Tragic 93.2% |
| Immigrants | Fiji | 0.0 /100 | #320 | Tragic 93.2% |
| Belizeans | 0.0 /100 | #321 | Tragic 93.1% |
| Nicaraguans | 0.0 /100 | #322 | Tragic 93.0% |
| Immigrants | Belize | 0.0 /100 | #323 | Tragic 92.9% |
| Nepalese | 0.0 /100 | #324 | Tragic 92.8% |
| Dominicans | 0.0 /100 | #325 | Tragic 92.8% |
| Central American Indians | 0.0 /100 | #326 | Tragic 92.7% |
| Immigrants | Azores | 0.0 /100 | #327 | Tragic 92.5% |
| Immigrants | Nicaragua | 0.0 /100 | #328 | Tragic 92.5% |
| Immigrants | Cabo Verde | 0.0 /100 | #329 | Tragic 92.4% |
| Immigrants | Armenia | 0.0 /100 | #330 | Tragic 92.3% |
| Hondurans | 0.0 /100 | #331 | Tragic 92.3% |
| Immigrants | Dominican Republic | 0.0 /100 | #332 | Tragic 92.3% |
| Hispanics or Latinos | 0.0 /100 | #333 | Tragic 92.2% |