Spaniard vs Sudanese 8th Grade
COMPARE
Spaniard
Sudanese
8th Grade
8th Grade Comparison
Spaniards
Sudanese
95.8%
8TH GRADE
60.0/ 100
METRIC RATING
167th/ 347
METRIC RANK
95.6%
8TH GRADE
33.0/ 100
METRIC RATING
187th/ 347
METRIC RANK
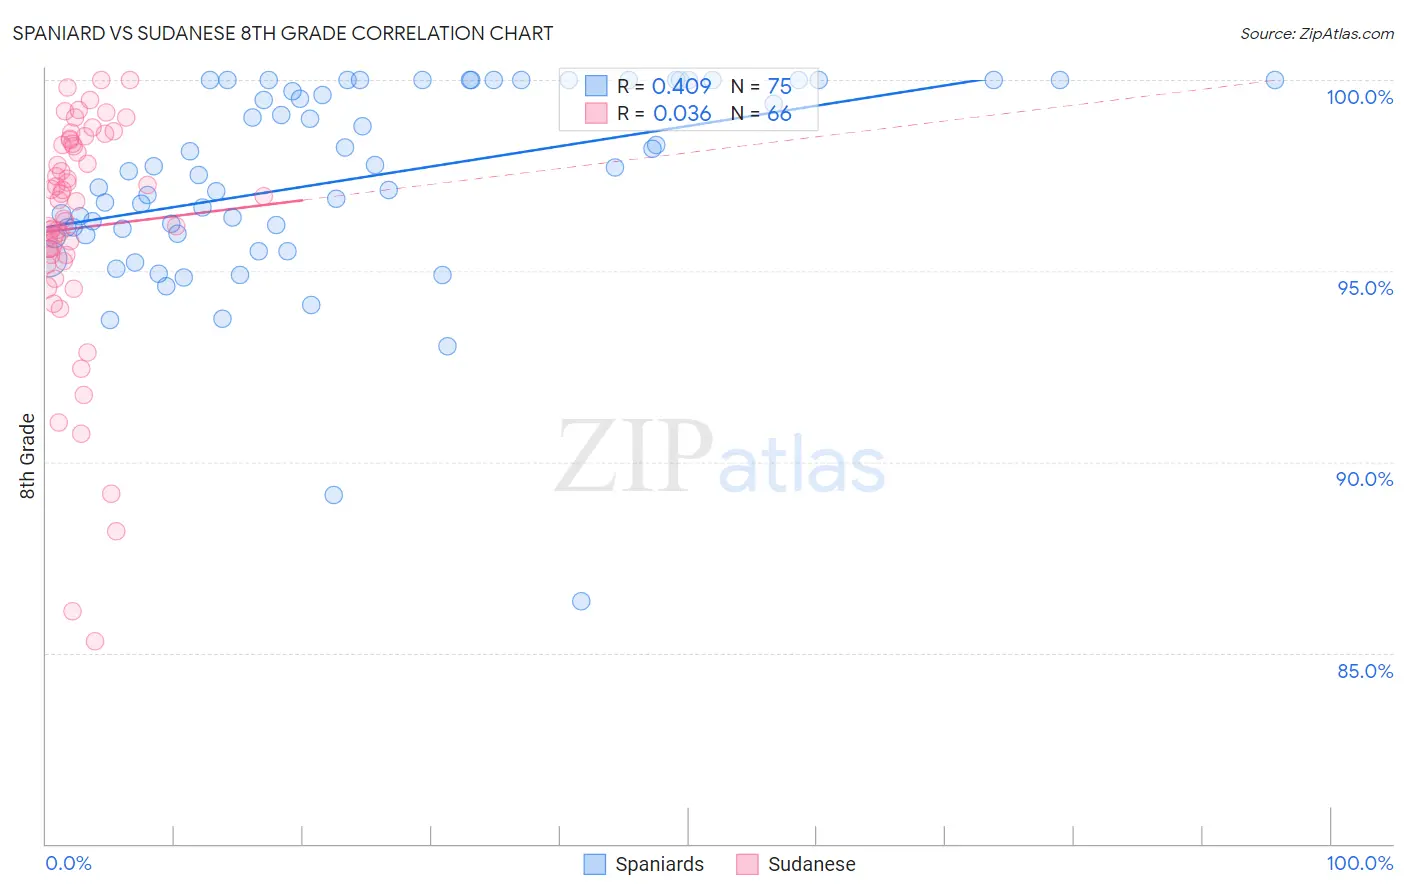
Spaniard vs Sudanese 8th Grade Correlation Chart
The statistical analysis conducted on geographies consisting of 443,544,503 people shows a moderate positive correlation between the proportion of Spaniards and percentage of population with at least 8th grade education in the United States with a correlation coefficient (R) of 0.409 and weighted average of 95.8%. Similarly, the statistical analysis conducted on geographies consisting of 110,124,633 people shows no correlation between the proportion of Sudanese and percentage of population with at least 8th grade education in the United States with a correlation coefficient (R) of 0.036 and weighted average of 95.6%, a difference of 0.18%.
8th Grade Correlation Summary
| Measurement | Spaniard | Sudanese |
| Minimum | 86.4% | 85.3% |
| Maximum | 100.0% | 100.0% |
| Range | 13.6% | 14.7% |
| Mean | 97.4% | 96.1% |
| Median | 97.6% | 96.8% |
| Interquartile 25% (IQ1) | 96.0% | 95.4% |
| Interquartile 75% (IQ3) | 100.0% | 98.3% |
| Interquartile Range (IQR) | 4.0% | 2.9% |
| Standard Deviation (Sample) | 2.6% | 3.1% |
| Standard Deviation (Population) | 2.6% | 3.1% |
Demographics Similar to Spaniards and Sudanese by 8th Grade
In terms of 8th grade, the demographic groups most similar to Spaniards are Immigrants from Ukraine (95.8%, a difference of 0.0%), Immigrants from Iran (95.8%, a difference of 0.010%), Ute (95.8%, a difference of 0.010%), Egyptian (95.8%, a difference of 0.010%), and Immigrants from Korea (95.8%, a difference of 0.010%). Similarly, the demographic groups most similar to Sudanese are Black/African American (95.6%, a difference of 0.010%), Brazilian (95.6%, a difference of 0.010%), Immigrants from Iraq (95.6%, a difference of 0.020%), Immigrants from Uganda (95.6%, a difference of 0.020%), and Immigrants from Egypt (95.7%, a difference of 0.030%).
| Demographics | Rating | Rank | 8th Grade |
| Spaniards | 60.0 /100 | #167 | Good 95.8% |
| Immigrants | Ukraine | 59.5 /100 | #168 | Average 95.8% |
| Immigrants | Iran | 58.6 /100 | #169 | Average 95.8% |
| Ute | 58.5 /100 | #170 | Average 95.8% |
| Egyptians | 58.2 /100 | #171 | Average 95.8% |
| Immigrants | Korea | 57.9 /100 | #172 | Average 95.8% |
| Mongolians | 53.0 /100 | #173 | Average 95.8% |
| Chileans | 50.0 /100 | #174 | Average 95.7% |
| Immigrants | Albania | 49.6 /100 | #175 | Average 95.7% |
| Pakistanis | 48.8 /100 | #176 | Average 95.7% |
| Marshallese | 47.6 /100 | #177 | Average 95.7% |
| Venezuelans | 47.5 /100 | #178 | Average 95.7% |
| Immigrants | Brazil | 45.4 /100 | #179 | Average 95.7% |
| Iraqis | 40.5 /100 | #180 | Average 95.7% |
| Immigrants | Spain | 38.7 /100 | #181 | Fair 95.7% |
| Immigrants | Egypt | 37.9 /100 | #182 | Fair 95.7% |
| Immigrants | Iraq | 36.2 /100 | #183 | Fair 95.6% |
| Immigrants | Uganda | 36.0 /100 | #184 | Fair 95.6% |
| Blacks/African Americans | 34.8 /100 | #185 | Fair 95.6% |
| Brazilians | 34.8 /100 | #186 | Fair 95.6% |
| Sudanese | 33.0 /100 | #187 | Fair 95.6% |