Spaniard vs Immigrants from Romania 8th Grade
COMPARE
Spaniard
Immigrants from Romania
8th Grade
8th Grade Comparison
Spaniards
Immigrants from Romania
95.8%
8TH GRADE
60.0/ 100
METRIC RATING
167th/ 347
METRIC RANK
96.2%
8TH GRADE
94.1/ 100
METRIC RATING
125th/ 347
METRIC RANK
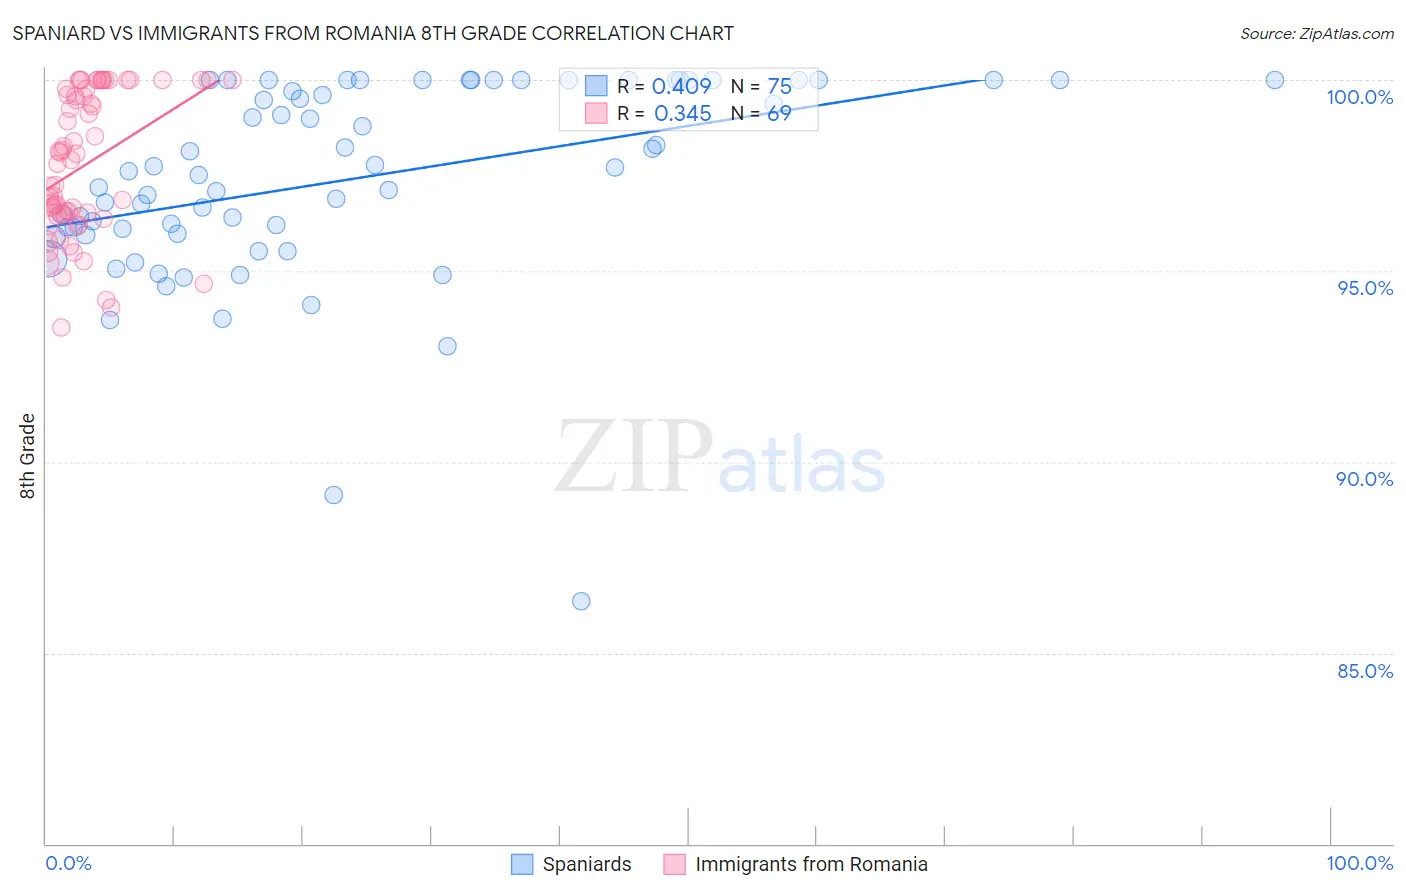
Spaniard vs Immigrants from Romania 8th Grade Correlation Chart
The statistical analysis conducted on geographies consisting of 443,544,503 people shows a moderate positive correlation between the proportion of Spaniards and percentage of population with at least 8th grade education in the United States with a correlation coefficient (R) of 0.409 and weighted average of 95.8%. Similarly, the statistical analysis conducted on geographies consisting of 257,008,799 people shows a mild positive correlation between the proportion of Immigrants from Romania and percentage of population with at least 8th grade education in the United States with a correlation coefficient (R) of 0.345 and weighted average of 96.2%, a difference of 0.38%.
8th Grade Correlation Summary
| Measurement | Spaniard | Immigrants from Romania |
| Minimum | 86.4% | 93.5% |
| Maximum | 100.0% | 100.0% |
| Range | 13.6% | 6.5% |
| Mean | 97.4% | 97.8% |
| Median | 97.6% | 97.9% |
| Interquartile 25% (IQ1) | 96.0% | 96.4% |
| Interquartile 75% (IQ3) | 100.0% | 99.8% |
| Interquartile Range (IQR) | 4.0% | 3.4% |
| Standard Deviation (Sample) | 2.6% | 1.9% |
| Standard Deviation (Population) | 2.6% | 1.9% |
Similar Demographics by 8th Grade
Demographics Similar to Spaniards by 8th Grade
In terms of 8th grade, the demographic groups most similar to Spaniards are Immigrants from Ukraine (95.8%, a difference of 0.0%), Alsatian (95.8%, a difference of 0.010%), Immigrants from Poland (95.8%, a difference of 0.010%), Immigrants from Iran (95.8%, a difference of 0.010%), and Ute (95.8%, a difference of 0.010%).
| Demographics | Rating | Rank | 8th Grade |
| Seminole | 67.7 /100 | #160 | Good 95.8% |
| Bermudans | 67.5 /100 | #161 | Good 95.8% |
| Immigrants | Kenya | 67.2 /100 | #162 | Good 95.8% |
| Immigrants | Sri Lanka | 64.1 /100 | #163 | Good 95.8% |
| Immigrants | Italy | 63.5 /100 | #164 | Good 95.8% |
| Alsatians | 61.4 /100 | #165 | Good 95.8% |
| Immigrants | Poland | 61.1 /100 | #166 | Good 95.8% |
| Spaniards | 60.0 /100 | #167 | Good 95.8% |
| Immigrants | Ukraine | 59.5 /100 | #168 | Average 95.8% |
| Immigrants | Iran | 58.6 /100 | #169 | Average 95.8% |
| Ute | 58.5 /100 | #170 | Average 95.8% |
| Egyptians | 58.2 /100 | #171 | Average 95.8% |
| Immigrants | Korea | 57.9 /100 | #172 | Average 95.8% |
| Mongolians | 53.0 /100 | #173 | Average 95.8% |
| Chileans | 50.0 /100 | #174 | Average 95.7% |
Demographics Similar to Immigrants from Romania by 8th Grade
In terms of 8th grade, the demographic groups most similar to Immigrants from Romania are Choctaw (96.2%, a difference of 0.0%), Immigrants from Serbia (96.2%, a difference of 0.0%), Palestinian (96.2%, a difference of 0.010%), Immigrants from Bosnia and Herzegovina (96.2%, a difference of 0.010%), and Filipino (96.2%, a difference of 0.020%).
| Demographics | Rating | Rank | 8th Grade |
| Immigrants | Norway | 95.7 /100 | #118 | Exceptional 96.2% |
| Immigrants | Switzerland | 95.3 /100 | #119 | Exceptional 96.2% |
| Immigrants | France | 95.3 /100 | #120 | Exceptional 96.2% |
| Immigrants | Bulgaria | 95.3 /100 | #121 | Exceptional 96.2% |
| Immigrants | Europe | 95.3 /100 | #122 | Exceptional 96.2% |
| Filipinos | 94.6 /100 | #123 | Exceptional 96.2% |
| Palestinians | 94.6 /100 | #124 | Exceptional 96.2% |
| Immigrants | Romania | 94.1 /100 | #125 | Exceptional 96.2% |
| Choctaw | 94.0 /100 | #126 | Exceptional 96.2% |
| Immigrants | Serbia | 94.0 /100 | #127 | Exceptional 96.2% |
| Immigrants | Bosnia and Herzegovina | 93.9 /100 | #128 | Exceptional 96.2% |
| Cheyenne | 93.3 /100 | #129 | Exceptional 96.1% |
| Soviet Union | 92.6 /100 | #130 | Exceptional 96.1% |
| Pueblo | 92.3 /100 | #131 | Exceptional 96.1% |
| Immigrants | Kuwait | 92.2 /100 | #132 | Exceptional 96.1% |